Download

1 / 21
210 likes | 481 Vues
Economic Fluctuations, Unemployment, and Inflation. Chapter 8. Which of the following are included in GDP?. Your mother-in-law buys a new car from a U.S. producer. Your mother-in-law buys a new car imported from Sweden.

E N D
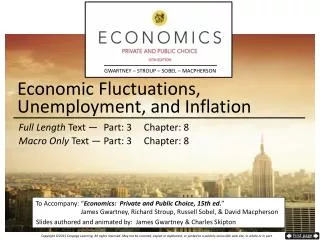
Economic Fluctuations, Unemployment, and Inflation Chapter 8
Which of the following are included in GDP? • Your mother-in-law buys a new car from a U.S. producer. • Your mother-in-law buys a new car imported from Sweden. • Your mother-in-law’s car rental business buys a new car from a U.S. producer. • Your mother-in-law’s car rental business buys a new car imported from Sweden. • The U.S. government buys a new domestically produced car for the use by your mother-in-law, who has been appointed the ambassador to Sweden.
20 10 0 –10 –20 1860 ‘70 ‘80 ‘90 1900 ‘10 ‘20 ‘30 ‘40 ‘50 ‘60 ‘70 ‘80 ‘90 2000 ‘10 U. S. Business Cycles World War II World War I Recovery of 1895 Civil War Korean War Vietnam War Panic of 1893 Panic of 1907 Great Depression McGraw-Hill/Irwin © 2004 The McGraw-Hill Companies, Inc., All Rights Reserved.
8 6 4 2 0 Long-run growth rate(approx. 3%) - 2 2000 2004 1960 1965 1970 1975 1980 1985 1990 1995 Instability in the Growth of Real GDP Annual growth rate of real GDP Source: Economic Report of the President, various issues.
Business Trend line peak Business peak Recessionary trough Expansion Contraction Recessionary trough The Hypothetical Business Cycle Real GDP Time
2001recession PotentialGDP 1990-91recession 1982recession 1980recession ActualGDP 1960recession 1974-75recession 1970recession Actual & Potential GDP, 1960-2003 Real GDP(billions of 2000 $) 10,000 8,000 6,000 4,000 2,000 1960 1965 1970 1975 1980 1985 1990 1995 2000 2003 Source: U.S. Department of Commerce, Bureau of Economic Analysis.
The Unemployment Rate • Measuring Unemployment Labor force = employed + unemployed
87 % 83% 78 % 76 % 74 % 60 % 58 % 46 % 38 % 33 % Labor Force Participation Rate of Men and Women: 1948-2003 Labor Force Participation Rate of Men and Women 1990 1990 1948 1960 1975 2003 1948 1960 1975 2003 –––––– Women –––––– ––––––– Men ––––––– Source: www.bls.gov.
223.4 million Civilian population 147.4 million 16 and over 76.0 million Civilian Not in the 8.1 million labor force labor force • Household workers • Students • Retirees • Disabled Employed Unemployed • Employees • New entrants • Self-employed • Reentrants 139.3 million workers • Lost last job • Quit last job 147.4 Civilian labor force = Labor Force Participation Rate = = • Laid off 223.4 Civilian population (16+) 139.3 = Number employed = Employment / Population Ratio = 223.4 Civilian population (16+) 8.1 Number unemployed = = Rate ofUnemployment = 147.4 Civilian labor force U.S. Population, Employment, and Unemployment: 2004 66.0% 62.3% 5.5%
19.3 % 15.6 % 10.6 % 9.3 % 6.3 % 6.0 % 5.7 % 5.0 % 4.6 % 20-24 16-19 25+ 16-19 20-24 25+ –– Women aged –– –– Men aged –– The Unemployment Rate By Age and Gender: 2003 Unemployment Rate, 2003 Allmen Allwomen Allworkers Source: www.bls.gov.
Average Unemployment Rate (1994-2003) 14.6 % Spain 10.6 % France 10.5 % Italy 8.6 % U.K. 6.5 % Germany 5.1 % U.S. 4.2 % Japan Source: Economic Outlook, OECD (June 2004).
Types of Unemployment Frictional: worker “between jobs” Cyclical: caused by bad economic conditions Structural: worker’s skill set is no longer in demand
Natural Rate of Unemployment Structural + Frictional • Average rate of unemployment over the business cycle. • Non-inflationary rate of unemployment. • Full-employment. • Associated with potential output.
Labor Force, unemployment rate & Participation Rate 65 people 10 <16 years of age 10 retired 25 full-time jobs 5 part-time jobs 5 full-time homemakers 5 full-time students over 16 2 disabled and cannot work Rest did not have jobs but wanted one but one has not searched in 3 months.
25 20 15 10 5 0 –5 –10 1900 10 20 30 40 50 60 70 80 90 2000 Inflation Since 1900 McGraw-Hill/Irwin © 2004 The McGraw-Hill Companies, Inc., All Rights Reserved.
1973-1981 averageinflation rate = 9.2 % 1983-2003 averageinflation rate = 3.1 % 1953-1965 averageinflation rate = 1.3 % The Inflation Rate, 1953-2003 Inflation rate 15 10 5 0 1955 1960 1965 1970 1975 1980 1985 1990 1995 2000 2003 Sources: Derived from computerized data supplied by FAME ECONOMICS. Also see Economic Report of the President (annual).