EMPLOYEE SURVEY
440 likes | 589 Vues
EMPLOYEE SURVEY. at the Royal Institute of Technology 2011. Division Report School of Electrical Engineering EES . Emlployee survey at KTH SCHOOL - E 2011 Response frequency 61 %. Basic Information. Background

EMPLOYEE SURVEY
E N D
Presentation Transcript
EMPLOYEE SURVEY at the Royal Institute of Technology 2011 Division Report School of Electrical Engineering EES
Emlployee survey at KTH SCHOOL - E 2011 Response frequency 61 %
Basic Information • Background • As a result of collaboration between KTH’s employer- and employee organizations the second common employee survey was carried out at KTH in October-November 2011. The themes/areas that formed the questionnaire were chosen on the basis of KTH’s protocols, development plans and personnel policy. • Execution • The survey was distributed to 3535 employees at KTH. Of these, 2197 participated in the survey, • giving a response frequency of 62 %. To ensure the confidentiality of the survey participants, only results that contain ten or more respondents are presented. Indexes for each staff category are not made public unless there are eight or more respondents. • Results • The report begins with an account of the results divided into ten comprehensive indexes: • Goals, Opportunities to Influence Your Own Work Situation, Workload, Competence, Motivation, Leadership Development, Internal Brand, Employee Satisfaction Index (ESI) and Work Related Health. • Six of these indexes are comparable with the previous survey from 2009. The report concludes by presenting correlational analyses for each school . • Method • The indexes are used as a briefing measure within a given questionnaire area. The aim is to be able to • describe and compare different questionnaire areas easily over time. The index value (reported as an integer) lies between 0-100, where 100 represents the best value. Factor analysis has been carried out on the entire response material, making it possible to collate between units/divisions and KTH’s overall results. Questions with a weaker factor loading (test coefficient) are not included in the indexes but are presented as simple response frequencies. • Correlational analyses have been conducted for all ten indexes.
Response frequency 2011 SCHOOL SELECTION PARTICIPANTS RESPONSE FREQUENCY School: E
Response frequency by staff category - 2011 Total number of respondents with managerial positions: 394
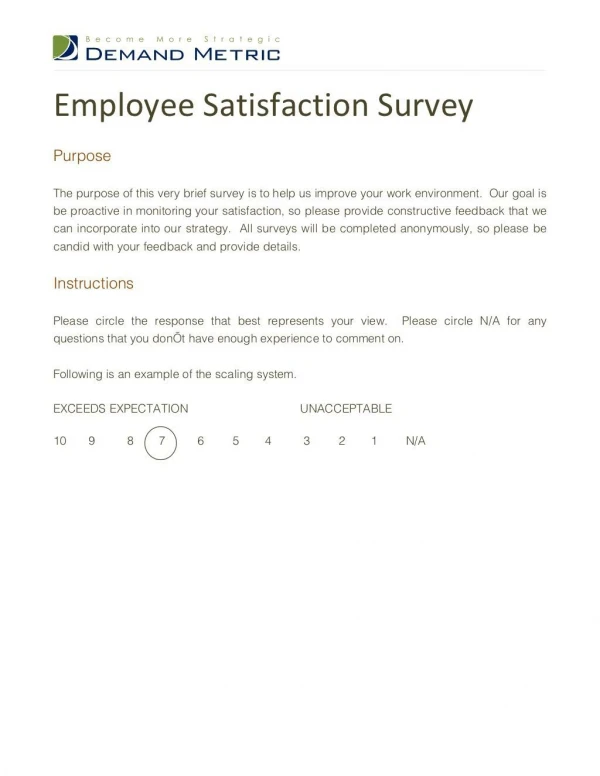
The possible response alternatives consisted in a scale of 10 categories where 1 meant “not at all true” or “very rarely or never”, whereas 10 meant “completely true” or “very often or all the time”. Not at allCompletely T rue true The response proportion is shown using a 3 level scale, where points 1-4 describe the answer “partly or completely false” or “rarely or very rarely”, points 5-6 describe “neither” or “sometimes” and points 7-10 describe the answer “partly or completely true” or “often or very often”. 1...................................................................10
Questions relating to Goals and Responsibility Figures in brackets show the 2009 results • A predominant proportion of the respondents have access to the • information they need to do a good job ( 80 % ) • Approx. 60 % state that there are clearly defined goals and that the • relationship between the goals of the division and KTH’s overall goals are clear Goals
Goals and Responsibility Index for all ten schools and the university administration
Questions relating to Influence and Control Figures in brackets show the 2009 results • This year 79 % report having the authority to make • decisions when their work requires it (75 %) • Many state that they most commonly have the • opportunity to influence the amount of work they have to do • Fewer feel this year that there is a disparity between • resources and work tasks (22 %)
Index for Opportunities to influence your own work situation, by staff category
Questions relating to Workload Figures in brackets show the 2009 results • A predominant proportion of the respondents often/very often have • periods when their workload peaks at high levels (79 %) • Many work at a high tempo and have too much to do • Fewer, 44 %, feel that they have good opportunities to recover between • periods of high work (54 %) Workload
Workload Index for all schools and the university administration
Questions relating to competence Figures in brackets show the 2009 results • Nearly 90 % feel that they have the competency required for their work • Most respondents, 72 %, also feel that they have sufficient opportunities • for vocational development (74 %) Competence
Questions relating to Motivation and Commitment • A predominant proportion of the respondents feel strongly committed • to their work and are willing to make an extra effort if this is required • 81 % look forward to going to work Motivation
Questions relating to Leadership Figures in brackets show the 2009 results • Nearly three quarter of the respondents feel that they are shown appreciation • for their performance and that they have support of their manager • 61 % also state that their manager gives them constructive • feedback on their work (60 % ) Leadership
Meeting activities Figures in brackets show the 2009 results • 79 % regularly participate at the meetings of their division/unit (82 %) • All types of questions can be aired and everyone can make themselves heard
Development Dialogue • Many of the respondents have been offered a development dialogue • during the past 12 months • 69 % consider the dialogue to be worthwhile • 31 % state that their development dialogue has been documented
Discrimination on the basis of sex Ph.D studies Research/Teaching Ph.D studies Technical/Administrative
Sexual harassment Other occurrences
Preventive work and routines relating to Discrimination and Harassment
Respondents’ assessements of KTH as an organisation Figures in brackets show the 2009 results • 84 % describe KTH as a good employer • This year, 67 %, have faith in KTH’s potential to become a perfect workplace (59 %) Internal Brand
Internal Brand Index for all schools and the university administration
Is there a relationship between self-assessed Health and various index areas ? Work load 0.53 Workrelated health 0.41 ESI 0.16 Motivation
Is there a relationship between motivation at work and various index areas ? Internal Brand 0.58 Leadership 0.22 MOTIVATION 0.21 Competence
Is there a relationship between the respondents’ assessments of KTH as an organisation and various index areas ? Leadership 0.43 Internal Brand 0.25 Discrimination