Download
1 / 58
580 likes | 982 Vues
Employee Benefits Interest Survey. November 2001. Executive Summary - Background. The County HR Department wanted to determine employee attitudes toward their benefit plan, including: Satisfaction with current programs. How they believe benefits compare with other employers.

E N D
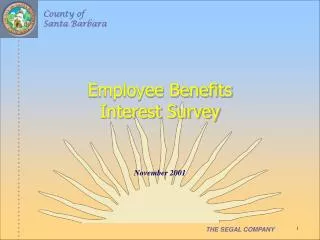
Employee BenefitsInterest Survey November 2001
Executive Summary - Background • The County HR Department wanted to determine employee attitudes toward their benefit plan, including: • Satisfaction with current programs. • How they believe benefits compare with other employers. • Additional benefits they would like to have. • The results of the survey will be used to help make policy decisions regarding County benefits.
Executive Summary - Methodology • 4,665 surveys distributed in electronic & hard copies. • 46.7% response rate (2,177 returned) • Typical is 18-20%
Executive Summary - Major Findings Perception of County benefits: • Job applicants to County positions generally believe County benefits are competitive in today’s market. • While the majority of employees believe the County’s benefits are better or the same as other employers’ at all stages of their career, those viewing benefits as worse increases slightly after the five years of on the job. • Job applicants indicate they are more willing than employees to work for better benefits, even if it means lower pay.
Executive Summary - Major Findings Perception of County benefits: • All three medical plans showed a high degree of overall satisfaction with their benefits, with the Health Net POS showing a slightly lower satisfaction level than the other two plans (18%). • Of the two dental plans, there was substantial dissatisfaction with the HMO (40%).
Executive Summary - Major Findings Top six desired benefit enhancements: (as determined by the percentage of respondents who ranked these as “Very interested” or “Interested”) • Improve retirement benefits - 91.9% • Increase County retirement offset - 89.5% • Increase County contribution toward employee medical coverage - 84.8% • Increase County benefit cash allowance - 84.7% • Increase County contribution toward employee dental coverage - 83.4% • Add or increase deferred comp contribution by County into a supplemental 401(a) - 78.1%
Introduction • The County of Santa Barbara faces tough competition for employees in the public sector • Benefits are a key selling point in attracting new hires • County officials want to: • Maximize the selling points of the County’s Benefit Program • Continue to develop a program that helps recruit & retain employees
Introduction - continued • The County employs roughly 4,000 active employees. • Benefits are centralized at the main office in Santa Barbara. • Employees are scattered 70 miles along the coast from Santa Maria to lower Ventura.
Objective • Objective of the survey was to determine employee attitudes about the County’s employee benefit programs, including: • Perceptions of the current program • How County benefits compare against other employers • What additional benefits would be most valued
Description of the Study - Research Strategy • This electronic survey gathered information in two ways: • Quantitative data - statistical analysis of survey questions (full summary of all responses are included in the Frequency Report in the Appendix) • Qualitative data - written comments from the survey • This was the first electronic benefit survey distributed to County employees and selected job applicants. • Survey was distributed to virtually all employees.
Who Responded: Men vs. Women? • The employees responding to the survey reflect the same age demographics of the workforce and therefore are a representative sample. • A larger percentage of women responded (62%). • This reflects the higher percentage (57%) of women in the County workforce.
Who Responded: How old were they? • The majority of the respondents were between the ages of 40 and 49 • A key consideration when looking at results with regard to important benefits, such as retirement 40% 30% 20% 10% 0% % of Total Respondents (2,040 Respondents)
Who Responded: Where do they live? • 52% of respondents live in North County: • Santa Maria • Lompoc • Buellton/Santa Ynez • San Luis Obispo • 45% of respondents live in South County • Santa Barbara • Ventura County
Who Responded: Do they have children? How many children do you have age 22 or younger and dependent on you for at least 50% of their support?
Who Responded: How much longer do you plan to work for the County?
Perception of County Benefits • “How do you think the County’s benefits for your occupation compare to those of other employers?” • 67% of all respondents believe the benefits are better or about the same as those provided by other employers
Perception of County Benefits - Length of Service • Applicants, as a group, felt that the County’s benefits where as good or better than other employers’ benefits … although they also had the largest number of “no opinion responses,” indicative of a lack of familiarity with the County plan. • Employees have the highest opinion of County benefits in their first five years of employment. The high overall level of satisfaction, while still majority opinion, is generally reduced as their employment period lengthens, possibly due to reduced familiarity with the details of other employers’ benefit plans.
Perception of Benefits - By Union Total Percentage Responding “Generally Better” or “Same” 1. Sheriffs' Manager Association - 92% 8. Engineers & Technicians Association - 61% 2. Confidential-Unrepresented Employees - 78% 9. Union of American Physicians and Dentists - 60% 3. SEIU, Local 620 - 73% 10. Deputy District Attorneys Association - 55% 4. Management Association - 69%11. Probation Peace Officers Association - 47% 5. Executive Association - 68% 12. Deputy Sheriffs Association - 43% 6. SEIU, Local 535 - 68% 13. Firefighters Association, Local 2046 - 20% 7. Applicant - Does Not Apply - 63%
Perception of Benefits - By Union • Of the four largest groups (100 respondents or more), in all but one, 60% of the respondents or more say County benefits are “better” or “the same” as other employers: • SEIU Local 620 (895 respondents) - 73% • SEIU Local 535 (281 respondents) - 68% • Deputy Sheriffs Association (233 respondents) - 43% • Management Association (131 respondents) - 69%
Perception of Benefits - By Union • Responses among the different organizations show few substantial differences. Average was 2.12, and median was 2 (“about the same”). • Since a very small number of responses were received from the groups with the highest and lowest percentages of positive responses, it is difficult to draw any meaningful conclusions from those groups. • Group that thinks the County compares best against other employers: Sheriffs Manager Association, with 25 respondents (1.2% of total). • Group that thinks the County compares worst against other employers: Fire Fighters Association with 20 respondents (less than 1% of total).
Enrollment in County Health Insurance Plans • 69.5% of County respondents have spouses or domestic partners • 32.3% choose to cover their partner on a County health insurance plan • Half of the respondents (49.9%) have dependent children eligible for coverage • 25.7% of all respondents choose family or self and children coverage • 10.4% of respondents are not enrolled in County health insurance plans
Members Not Covered by County Health Insurance Plans • A total of 34% of members who chose against taking County benefits felt they were getting a better price through a spouse’s or partner’s plan • Only 10% believe the spouse’s plan has better coverage
Benefits vs. Salary • Respondents said they were moderately in favor of ranking benefits over salary: • Agree - 40% • Neutral - 36% • Disagree - 24%
Salary vs. Benefits by Gender • There was no substantial difference in the responses between men and women with regard to ranking benefits over salary.
Salary vs. Benefits by Gender • When the question was rephrased to offer a choice between increasing salary vs. improving benefits, there was a moderately higher preference by men of salary over benefits, as compared to responses by women.
Perception of Benefits - Applicant vs. Employee • There is a direct correlation between applicant vs. employee with regard to perception of benefits. • A higher percentage of applicants over employees feel that the County’s benefits are the same or better than those offered by other employers • Employees with a longer tenure have a somewhat higher perception of other employers’ benefits as being better than the County’s.
Value of Benefits - Applicant vs. Employee Generally, applicants expressed more interest in working for better benefits and lower pay, than any category of employee 225* 165* 213* 104* 79* 58* * Total number answering “Agreed” and “Agreed Strongly” for each category
Satisfaction with County Medical Plans Of the three medical plans, there was the least degree of satisfaction with the Health Net POS benefits (18%).
Satisfaction with County Medical Plans - By area North County South County Overall 53% of those enrolled answered “satisfied” or “very satisfied”
Satisfaction with County Dental Plans Of the two dental plans, there was substantial dissatisfaction with the HMO (40%).
Satisfaction with County Dental Plans - By area North County South County Overall 46% of those enrolled answered “satisfied” or “very satisfied”
Satisfaction with the Medical HMO Choice of Providers A total of 48% of participants were not satisfied with their choice of medical providers.
Satisfaction with the Dental HMO Choice of Providers In a similar fashion, 44% participants were unhappy with the choice of dental HMO providers.
Survey Results: What Employees Value Most The most popular account was the cash allowance for benefits, with 72.6% of respondents ranking it as most important or important.
Survey Results: What Employees Appreciate 98% 95% 94% 78% 74% 69% 54% 51% 49% 43% 41% 38% 31% 27%
Survey Results: What’s Most Important 96% 94% 91% 85% 84% 61% 58% 51% 44% 43% 43% 41% 39% 39% 23%
What Changes Do They Want?All Respondents • The top five responses (receiving more than 80% support) include: • Improve retirement benefits • Increase County retirement offset • Increase County contribution toward employee medical coverage • Increase County benefit cash allowance • Increase County contribution toward dental coverage
Desired Benefit Changes by Rank Order Engineers and Technicians
Desired Benefit Changes by Rank Order Deputy District Attorney