Download
1 / 1
10 likes | 198 Vues
Using NPOL (the NASA S-band polarimetric radar), and a network of 2D video disdrometers for external radar calibration and rain rate estimation, and to determine spatial correlation of rain drop size distribution parameters.

E N D
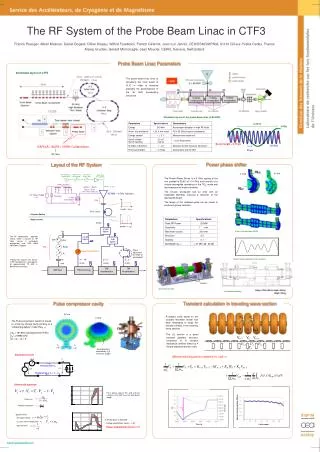
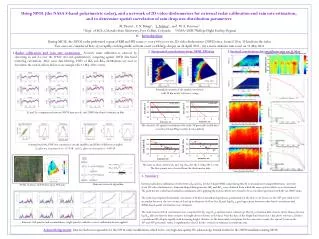
Using NPOL (the NASA S-band polarimetric radar), and a network of 2D video disdrometers for external radar calibration and rain rate estimation, and to determine spatial correlation of rain drop size distribution parameters M. Thurai1, V. N. Bringi1, L. Tolstoy1, and W. A. Petersen2 1 Dept. of ECE, Colorado State University, Fort Collins, Colorado, 2 NASA/GSFC Wallops Flight Facility, Virginia 0. Introduction During MC3E, the NPOL radar performed repeated RHI and PPI scans (~ every 40 s) over six 2D video disdrometer (2DVD) sites, located 20 to 35 km from the radar. Two cases are considered here: (i) a rapidly evolving multi-cell rain event (with large drops) on 24 April 2011; (ii) a more uniform rain event on 11 May 2011 2. Horizontal correlations from NPOL PPI data 3. Vertical correlations for stratiform rain on 11 May • Radar calibration and rain rate estimation: Accurate radar calibration is achieved by extracting Zh and Zdr over the 2DVD sites and quantitatively comparing against 2DVD data-based scattering calculations. After some data filtering, PDF’s of ΔZh and ΔZdr distributions are used to determine the system offsets. Below is an example (the 11 May 2011 event). 24 Apr 2011 11 May 2011 Azimuthal variation of the spatial correlation, with 20 km as the ‘reference’ range Zh and Zdr comparisons between NPOL data in red, and 2DVD data based estimates in blue The effective 1D spatial correlations of R at the 50 percentile (solid line) as well as 10 and 90 percentile levels (dashed) Scatterplots (left), PDF’s for consistency checks (middle) and PDFs of differences (right) Zh offset was determined to be -0.79 dB and Zdr offset was determined to -0.09 dB. The same as above, but for D0 and log (NW) for the 11 May 2011 event. The blue points were derived from the disdrometer data. • Summary • External (absolute) calibration of reflectivity (Zh) and Zdr for the S-band NPOL radar during MC3E is demonstrated using DSDs from a network • of six 2D-video disdrometers. Gaussian-shaped histograms for ∆Zh and ∆Zdr were obtained from which the mean system offsets were determined. • The polarimetric-radar based rainfall accumulations after applying the system offsets were found to be in excellent agreement with the six 2DVD units. • The radar-based spatial (horizontal) correlation of R shows azimuthal dependence, particularly for the first event. However, the 50th percentile levels • are similar between the two events, at least up to distances of 4 km. For D0 and log(NW), good agreement between radar-based correlations and • 2DVD-based spatial correlations were obtained. • The radar-based vertical correlations were computed for D0, log (NW) and rain water content (q). The D0-correlation falls of more slowly than q whereas • log NW falls of relatively faster (relative to height above reference at 0.6 km). Near the base of the bright-band located at 2 km above reference, all three • correlations fall off quite rapidly with increasing height. Relative to the horizontal correlations for the convective events, the ‘spread’ between the • 10th and 90th percentile values is significantly reduced for the vertical correlations in stratiform rain. Rain rate retrieval algorithm NPOL location, 2DVD sites and a PPI scan Rain rate (left panels) and accumulations (right panels), with the correct calibration factors applied Acknowledgements: John Gerlach was responsible for the NPOL radar modifications which led to very high data quality. We acknowledge Patrick Gatlin for the 2DVD installation during MC3E.