Download
1 / 36
360 likes | 385 Vues
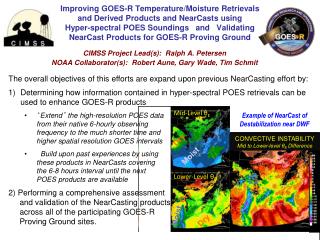
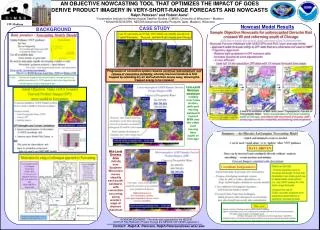
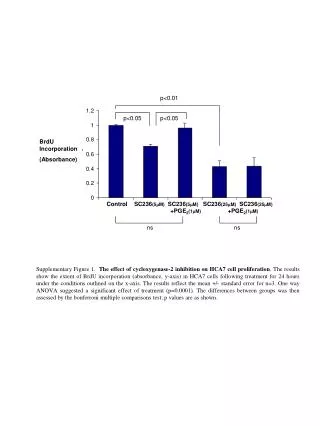
This study aims to improve the accuracy of severe thunderstorm forecasts using a dynamic nearcasting approach that incorporates GOES moisture products. The goal is to provide objective tools that help forecasters anticipate rapidly developing weather events and fill the gap between nowcasting and NWP.

E N D
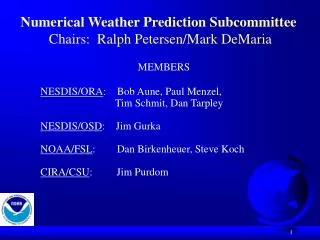
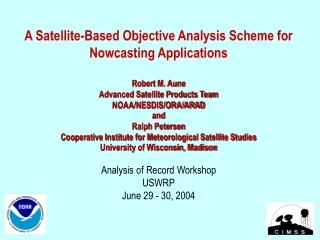
Dynamic NearCasting of Severe Convection using Sequences of GOES Moisture Products- Applicability to NASA Aviation Program? - Ralph Petersen1and Robert M Aune2 1 Cooperative Institute for Meteorological Satellite Studies (CIMSS), University of Wisconsin – Madison, Madison, Wisconsin, Ralph.Petersen@NOAA.GOV 2 NOAA/NESDIS/ORA, Advanced Satellite Products Team, Madison, Wisconsin, Robert.Aune@NOAA.GOV Improving the utility of GOES products in operational forecasting
What are we trying to correct? • - Poor precipitation forecast accuracy in very-short-range NWP • - Lack of ANY satellite moisture data in NWP over land in US • Excessive smoothing of mesoscale moisture patterns • in NWP data assimilation • Smoothing of upper-level dynamics and dryness • Dominance of parameterizations over observations • in increasingly complex short-range NWP • - Time delay in getting updated NWP guidance to forecasters What are we trying to improve? Short-range forecasts of timing and locations of severe thunderstorms - especially hard-to-forecast, isolated summer-time convection How? Provide objective tools that preserves GOES observations and help forecasters identify pre-convective environments 1-6 hours in advance
Goals: Provide objective tools that allow forecasters to expand the usefulness of proven GOES Observations in very-short range predictions NearCasting Models Should: Fill the 1-6 hr “Guidance Gap” Update/Enhance NWP guidance: Be Fast and updated very frequently Use ALL available data - quickly: “Draw closely” to good data Avoid ‘analysis smoothing’ / ‘super-ob-ing’ issues of longer-range NWP Help anticipate rapidly developing weather events: “Perishable” guidance products – need rapid delivery Run Locally? – Few resources needed beyond comms, users easily trained Improve Situational Awareness Initial Focus on detecting the “Pre-Storm Environment” - Increase Lead Time / Probability of Detection (POD) and Reduce False Alarm Rate (FAR) Fill the Gap Between Nowcasting & NWP 0 1 5 6 hours
0700 UTC GOES Sounder products images already are available to forecasters Products currently available include: - Total column Precipitable Water (TPW) - Stability Indices, . . . (Similar to GII) - 3-layers Precipitable Water (PW) . . . Build upon GOES’ Strengths + Derived Product Images (DPI) of soundings speeds comprehension of information, and + Data Improve upon Model First Guess, A Specific Objective: Expand the benefits of valuable Moisture Information contained in GOES Sounder Derived Product Images (DPI) GOES 900-700 hPa PW - 20 July 2005 Improvement of GOES DPI over NWP guess
1800 UTC A Specific Objective: Expand the benefits of valuable Moisture Information contained in GOES Sounder Derived Product Images (DPI) GOES 900-700 hPa PW - 20 July 2005 GOES Sounder products images already are available to forecasters Products currently available include: - Total column Precipitable Water (TPW) - Stability Indices, . . . (Similar to GII) - 3-layers Precipitable Water (PW) . . . Build upon GOES’ Strengths + Derived Product Images (DPI) of soundings speeds comprehension of information, and + Data Improve upon Model First Guess, BUT( Address some operational realities ) - - - - DPIs used primarily as observations - No predictive component - 3-layerDPIs not used in current NWP models - DPIs often obscured when needed most - Correctly anticipated cloud developments obscure subsequent IR observations Need to add a DPI predictive capability to close these information gaps Improvement of GOES DPI over NWP guess
Moving Observations to Forecasts Why use a Lagrangian approach for NearCasting? Extending a proven diagnostic approach to prediction - Quick- (10-15 minute time steps) and minimal resources needed - Can be used ‘stand-alone’ or to ‘update’ other NWP guidance DATA DRIVEN – Observation ‘tracked’ into the future - Uses Observations Directly - No ‘analysis smoothing’ - Retains observed maxima and minima and extreme gradients - GOES data can be projected forward at full resolution- Spatial resolution adjusts to available data density - Moves mid-/low-level features into areas where clouds form- Provides information even after IR obs are obscured by cirrus Stability Indices derived from projected Temp/Humidity ‘data’ - New data are added at time observed – not binned / averaged - Data can be included (aged) from multiple observation times
Lagrangian NearCast Dry Moist How it works: Start with a DPI image, 13 April 2006 – 2100 UTC 900-700 hPa GOES PW 0 Hour NearCast
Lagrangian NearCast Dry Moist How it works: Start with a DPI image, interpolate wind data to each of the moisture obs, 13 April 2006 – 2100 UTC 900-700 hPa GOES PW 0 Hour NearCast
Lagrangian NearCast How it works: Start with a DPI image, interpolate wind data to each of the moisture obs, then move the 10 km data to new locations 13 April 2006 – 2100 UTC 900-700 hPa GOES PW 0 Hour Ob Locations
Lagrangian NearCast How it works: Start with a DPI image, interpolate wind data to each of the moisture obs, then move the 10 km data to new locations ( use ‘long’ (10 minute) time steps and dynamically change wind fields ), 13 April 2006 – 2100 UTC 900-700 hPa GOES PW 1 Hour NearCast Obs
Lagrangian NearCast How it works: Start with a DPI image, interpolate wind data to each of the moisture obs, then move the 10 km data to new locations ( use ‘long’ (10 minute) time steps and dynamically change wind fields), 13 April 2006 – 2100 UTC 900-700 hPa GOES PW 2 Hour NearCast Obs
Lagrangian NearCast How it works: Start with a DPI image, interpolate wind data to each of the moisture obs, then move the 10 km data to new locations ( use ‘long’ (10 minute) time steps and dynamically change wind fields), 13 April 2006 – 2100 UTC 900-700 hPa GOES PW 3 Hour NearCast Obs
Lagrangian NearCast Dry Moist How it works: Start with a DPI image, interpolate wind data to each of the moisture obs, then move the 10 km data to new locations ( use ‘long’ (10 minute) time steps and dynamically change wind fields), and finally. transfer the “projected” moisture ‘obs’ back to a regular grid, 13 April 2006 – 2100 UTC 900-700 hPa GOES PW 3 Hour NearCast 10 km data, 10 minute time steps
Lagrangian NearCast Dry Moist How it works: Start with a DPI image, interpolate wind data to each of the moisture obs, then moves the 10 km data to new locations ( use ‘long’ (10 minute) time steps and dynamically change wind fields), and finally. transfer the “projected” moisture ‘obs’ back to a regular grid, but only to create images of the DPI NearCasts. 13 April 2006 – 2100 UTC 900-700 hPa GOES PW 3 Hour NearCast Image 10 km data, 10 minute time steps
Moving GOES data from Observations to Forecasts What are we looking for? Use what GOES observes well ! Proof of Concept: Identify areas with large vertical moisture gradients RAPID convection development often observed under and along edges of mid-level dry bands as they move over localized low-level moisture maxima
A Example: Hail storm event of 13 April 2006 that caused record property damage across southern Wisconsin The important questions are both Where and When severe convection will develop, and Where convection will NOT occur - even after cirrus blow-off obscures IR observations? 24 Hr Precip 10 cm Hail NWP models placed precipitation too far south and west - in area of large-scale moisture convergence
Moving GOES data from Observations to Forecasts Initial Conditions 0 Hour Moisture for 2100UTC From 13 April 2006 2100UTC GOES Derived Product Images 900-700 hPa PW 700-300 PW Comparison with integrated NWP Moisture fields Initial GOES DPIs Valid 2100 UTC Hail-Storm Path NWP Analysis Comparison 2115 UTC Sat Imagery NAM 03h Forecast of 700-300 hPa and 900-700 hPa PW valid 2100 UTC NWP has: Moisture in wrong locations Gradients too weak by factor of 4-8 13 April 2006 – 2100 UTC 700-300 hPa GOES PW 0 Hour NearCast 13 April 2006 – 2100 UTC 900-700 hPa GOES PW 0 Hour NearCast
Moving GOES data from Observations to Forecasts NearCasts 0 Hour Projection for 2100UTC From 13 April 2006 2100UTC GOES Derived Product Images 900-700 hPa PW 700-300 PW 0 hr Lagrangian NearCasts of GOES DPIs Valid 2100 UTC Hail-Storm Path Low-level Moisture Motion 2115 UTC Sat Imagery Low-Level Moistening Low-Level Moistening 13 April 2006 – 2100 UTC 700-300 hPa GOES PW 0 Hour NearCast 13 April 2006 – 2100 UTC 900-700 hPa GOES PW 0 Hour NearCast
Moving GOES data from Observations to Forecasts NearCasts 2 Hour Projection for 2300UTC From 13 April 2006 2100UTC GOES Derived Product Images 900-700 hPa PW 700-300 PW 2 hr Lagrangian NearCasts of GOES DPIs Valid 2300 UTC Hail-Storm Path Low-level Moisture Motion 2315 UTC Sat Imagery Low-Level Moistening 13 April 2006 – 2100 UTC 700-300 hPa GOES PW 2 Hour NearCast 13 April 2006 – 2100 UTC 900-700 hPa GOES PW 2 Hour NearCast
Moving GOES data from Observations to Forecasts NearCasts 4 Hour Projection for 0100UTC From 13 April 2006 2100UTC GOES Derived Product Images 900-700 hPa PW 700-300 PW 4 hr Lagrangian NearCasts of GOES DPIs Valid 0100 UTC Hail-Storm Path Low-level Moisture Motion 0115 UTC Sat Imagery Low-Level Moistening 13 April 2006 – 2100 UTC 700-300 hPa GOES PW 4 Hour NearCast 13 April 2006 – 2100 UTC 900-700 hPa GOES PW 4 Hour NearCast
Moving GOES data from Observations to Forecasts NearCasts 6Hour Projection for 0300UTC From 13 April 2006 2100UTC GOES Derived Product Images 900-700 hPa PW 700-300 PW 6 hr Lagrangian NearCasts of GOES DPIs Valid 0300 UTC Hail-Storm Path Low-level Moisture Motion 0315 UTC Sat Imagery Low-Level Moistening 13 April 2006 – 2100 UTC 700-300 hPa GOES PW 6 Hour NearCast 13 April 2006 – 2100 UTC 900-700 hPa GOES PW 6 Hour NearCast
Moving GOES data from Observations to Forecasts NearCasts 0 Hour Projection for 2100UTC From 13 April 2006 2100UTC GOES Derived Product Images 900-700 hPa PW 700-300 PW 0 hr Lagrangian NearCasts of GOES DPIs Valid 2100 UTC Hail-Storm Path Mid-level Dryness Motion 2115 UTC Sat Imagery Mid-Level Drying Mid-Level Drying 13 April 2006 – 2100 UTC 700-300 hPa GOES PW 0 Hour NearCast 13 April 2006 – 2100 UTC 900-700 hPa GOES PW 0 Hour NearCast
Moving GOES data from Observations to Forecasts NearCasts 2 Hour Projection for 2300UTC From 13 April 2006 2100UTC GOES Derived Product Images 900-700 hPa PW 700-300 PW 2 hr Lagrangian NearCasts of GOES DPIs Valid 2300 UTC Hail-Storm Path Low-level Dryness Motion 2315 UTC Sat Imagery Mid-Level Drying 13 April 2006 – 2100 UTC 700-300 hPa GOES PW 2 Hour NearCast 13 April 2006 – 2100 UTC 900-700 hPa GOES PW 2 Hour NearCast
Moving GOES data from Observations to Forecasts NearCasts 4 Hour Projection for 0100UTC From 13 April 2006 2100UTC GOES Derived Product Images 900-700 hPa PW 700-300 PW 4 hr Lagrangian NearCasts of GOES DPIs Valid 0100 UTC Hail-Storm Path Low-level Dryness Motion 0115 UTC Sat Imagery Mid-Level Drying 13 April 2006 – 2100 UTC 700-300 hPa GOES PW 4 Hour NearCast 13 April 2006 – 2100 UTC 900-700 hPa GOES PW 4 Hour NearCast
Moving GOES data from Observations to Forecasts NearCasts 6Hour Projection for 0300UTC From 13 April 2006 2100UTC GOES Derived Product Images 900-700 hPa PW 700-300 PW 6 hr Lagrangian NearCasts of GOES DPIs Valid 0300 UTC Hail-Storm Path Low-level Dryness Motion 0315 UTC Sat Imagery Mid-Level Drying 13 April 2006 – 2100 UTC 700-300 hPa GOES PW 6 Hour NearCast 13 April 2006 – 2100 UTC 900-700 hPa GOES PW 6 Hour NearCast
Moving GOES data from Observations to Forecasts NearCasts 6Hour Projection for 0300UTC From 13 April 2006 2100UTC GOES Derived Product Images 900-700 hPa PW 700-300 PW Are these Moisture Changes Real ? Rapid moisture changes NearCasted in NE Iowa validated by GPS TPW 6 hr Lagrangian NearCasts of GOES DPIs Valid 0300 UTC Hail-Storm Path VALIDATION with GPS TPW 0315 UTC Sat Imagery GOES NearCast 900-300 PW = 10 + 3 = 13 GPS TPW = 16 13 Mid-Level Drying Validation of Local NE Iowa moisture maximum with GPS TPW data 13 April 2006 – 2100 UTC 700-300 hPa GOES PW 6 Hour NearCast 13 April 2006 – 2100 UTC 900-700 hPa GOES PW 6 Hour NearCast
Moving GOES data from Observations to Forecasts Vertical Moisture Gradient (900-700 hPa GOES PW - 700-500 hPa GOES PW) 0 Hour NearCast for 2100UTC From 13 April 2006 2100UTC Formation of Convective Instability 0 hr Lagrangian NearCasts of GOES DPIs Valid 2100 UTC Hail-Storm Path Observed Instability Vertical Moisture Difference . 2115 UTC Sat Imagery Differential Moisture Transport Creates Convective Instability in hours Differential Moisture Transport Creates Vertical Moisture Gradients 13 April 2006 – 2100 UTC 700-300 hPa GOES PW 0 Hour NearCast 13 April 2006 – 2100 UTC 900-700 hPa GOES PW 0 Hour NearCast
Moving GOES data from Observations to Forecasts Vertical Moisture Gradient (900-700 hPa GOES PW - 700-500 hPa GOES PW) 2 Hour NearCast for 2300UTC From 13 April 2006 2100UTC Formation of Convective Instability 2 hr Lagrangian NearCasts of GOES DPIs Valid 2100 UTC NearCast Instability Vertical Moisture Difference . 2315 UTC Sat Imagery Differential Moisture Transport Creates Vertical Moisture Gradients 13 April 2006 – 2100 UTC 700-300 hPa GOES PW 2 Hour NearCast 13 April 2006 – 2100 UTC 900-700 hPa GOES PW 2 Hour NearCast
Moving GOES data from Observations to Forecasts Moving from Observations to Forecasts Vertical Moisture Gradient (900-700 hPa GOES PW - 700-500 hPa GOES PW) 4 Hour NearCast for 0100UTC From 13 April 2006 2100UTC Formation of Convective Instability 4 hr Lagrangian NearCasts of GOES DPIs Valid 2100 UTC NearCast Instability Vertical Moisture Difference . 0115 UTC Sat Imagery Differential Moisture Transport Creates Vertical Moisture Gradients 13 April 2006 – 2100 UTC 700-300 hPa GOES PW 4 Hour NearCast 13 April 2006 – 2100 UTC 900-700 hPa GOES PW 4 Hour NearCast
Moving GOES data from Observations to Forecasts Vertical Moisture Gradient (900-700 hPa GOES PW - 700-500 hPa GOES PW) 6 Hour NearCast for 0300UTC From 13 April 2006 2100UTC Formation of Convective Instability 6 hr Lagrangian NearCasts of GOES DPIs Valid 2100 UTC NearCast Instability Vertical Moisture Difference . 0315 UTC Sat Imagery 0315 UTC Sat Imagery Differential Moisture Transport Creates Vertical Moisture Gradients 13 April 2006 – 2100 UTC 700-300 hPa GOES PW 6 Hour NearCast 13 April 2006 – 2100 UTC 900-700 hPa GOES PW 6 Hour NearCast
Moving GOES data from Observations to Forecasts Vertical Moisture Gradient (900-700 hPa GOES PW - 700-500 hPa GOES PW) 6 Hour NearCast for 0300UTC From 13 April 2006 2100UTC 0315 UTC Sat Imagery Formation of Convective Instability 6 hr Lagrangian NearCasts of GOES DPIs Valid 2100 UTC Critical Information about Timing and Location of Mesoscale Destabilzation LOST without NearCast Vertical Moisture Difference Information Added by NearCasts . 0315 UTC Sat Imagery Low-Level Moistening Mid-Level Drying Differential moisture transports into cloudy regions produces small instability areas 13 April 2006 – 2100 UTC 700-300 hPa GOES PW 6 Hour NearCast 13 April 2006 – 2100 UTC 900-700 hPa GOES PW 6 Hour NearCast
Examples like this show that: • - The GOES DPI moisture products provide good data (if available) • - The Lagrangian NearCasts produce useful and frequently updates about the FUTURE stability of the atmosphere • - - - - - - - - - - - - - - - - - - - - - - - - - - - - - - - - - - - - - - - - - - - - - - - - - • A number of additional modifications have been made to • Make the image products more useful in operations: • Added Data Obscuration ‘Flags’ (no-info areas on images) • Decreased specificity (detail) with time • Increased Temporal Consistency • (Incorporated information from 5 previous hourly NearCasts into display image) Initial Conditions 0 Hour Moisture for 2100UTC From 13 April 2006 2100UTC GOES Derived Product Images 900-700 hPa PW 700-300 PW Initial GOES DPIs Valid 2100 UTC 2115 UTC Sat Imagery 13 April 2006 – 2100 UTC 700-300 hPa GOES PW 0 Hour NearCast 13 April 2006 – 2100 UTC 900-700 hPa GOES PW 0 Hour NearCast
Examples like this show that: • - The GOES DPI moisture products provide good data (if available) • - The Lagrangian NearCasts produce useful and frequently updates about the FUTURE stability of the atmosphere • - - - - - - - - - - - - - - - - - - - - - - - - - - - - - - - - - - - - - - - - - - - - - - - - What next? • 24/7 Real-Time runs underway - Output in GRIB-II • Will include more GOES derived hazardous weather forecasting parameters – θe, LI, Cape, . . . Initial Conditions 0 Hour Moisture for 2100UTC From 13 April 2006 2100UTC GOES Derived Product Images 900-700 hPa PW 700-300 PW Initial GOES DPIs Valid 2100 UTC 2115 UTC Sat Imagery 13 April 2006 – 2100 UTC 700-300 hPa GOES PW 0 Hour NearCast 13 April 2006 – 2100 UTC 900-700 hPa GOES PW 0 Hour NearCast
Indices MUST be derived from parameters that GOES observes well!!! Choosing which additional parameters (indices) to use is critical • For GOES sounder and GOES-R ABI, this means: • - ~2-3 layers of Moisture (q) and ~5-6 layers of Temperature (T) Information - • Build upon GII experiences: Candidate Indices will be derived from T/q NearCasts at each observing layer • Lifted Index – Simple – T&Q at 2 layers only - Compares temperature of parcel lifted form boundary layer to 500 hPa temperature (Modify and Re-scale/Calibrate for GOES obs. layers) Total Index – Simple – T&Q at 2 layers only – Compares 850 hPa T/Q with 500 hPa T and 850-500 hPa lapse rate info. (Modify and Re-scale/Calibrate for GOES layers) Convective Instability – Combines T&Q – Compares Equivalent Potential Temperature (θe - Total Thermal Energy) between low- and mid-tropospheric layers – (In-storm buoyancy realized after convection begins– Need to modify and Re-scale/Calibrate for GOES layers) Convective Available Potential Energy – Uses low-level T&Q with upper-level T profiles - Compare temperature of parcel lifted form boundary layer through ALL levels to tropopause – (Total buoyancy – Modify and Re-scale/Calibrate for GOES layers) Convective Inhibition – T only - Compares of low/mid-level Temperature – (Total buoyancy – Modify and Re-scale/Calibrate for GOES layers) • K Index– Combines low/mid level T & Q – (Useful for tropical convection – (Modify and Re-scale/Calibrate for GOES layers) Multiple Index Ensembles - May require tuning for different areas/conditions
Examples like this show that: • - The GOES DPI moisture products provide good data (if available) • - The Lagrangian NearCasts produce useful and frequently updates about the FUTURE stability of the atmosphere • - - - - - - - - - - - - - - - - - - - - - - - - - - - - - - - - - - - - - - - - - - - - - - - - What next? • - 24/7 Real-Time runs underway - Output in GRIB-II • Will include more GOES derived hazardous weather forecasting parameters – θe, LI, Cape, . . . • WFO evaluation: Is this a useful forecasting tool? • - If so, when and when not? • -What additional tuning/parameters are needed? • How should it be tested? • - Web-based initially - then directly to AWIPS • Testing scheduled at NWS Central region WFOs, AWC, NSSL, . . . • Planning tests with METEOSAT data as a GOES-R ABI Risk Reduction Initial Conditions 0 Hour Moisture for 2100UTC From 13 April 2006 2100UTC GOES Derived Product Images 900-700 hPa PW 700-300 PW Initial GOES DPIs Valid 2100 UTC 2115 UTC Sat Imagery 13 April 2006 – 2100 UTC 700-300 hPa GOES PW 0 Hour NearCast 13 April 2006 – 2100 UTC 900-700 hPa GOES PW 0 Hour NearCast
Summary – An Objective Lagrangian NearCasting Model - Quick and minimal resources needed - Can be used ‘stand-alone’ or to ‘update’ other NWP guidance Questions ? Can this useful for any of the NASA Aviation efforts? Extend Convective Initiation Nowcasts? Help with Oceanic Weather, especially Convection and Convectively Induced Turbulence? (Could use AIRS/IASI products here!) Other Areas? DATA DRIVEN at the MESOSCALE - Data can be inserted (combined) directly retaining resolution and extremes - NearCasts retain useful maxima and minima – image cycling preserves old data Forecast Images agree with storm formations and provide accurate/timely guidance • Goals met: • Provides objective tool to increase the length of time that forecasters can make good use of detailed GOES moisture data in their short range forecasts (augment smoother NWP output) • Expands value of GOES • moisture products from observations to short-range forecasting tools • Evaluations in NWS offices • Options for METEOSAT tests Stable Unstable Differential Moisture Transport Creates Convective Instability Dry Moist