Download
1 / 25
250 likes | 270 Vues
This project aims to develop an objective analysis system for nowcasting that utilizes the temporal and spatial attributes of the GOES sounder. It prioritizes observation-based analysis, preserves gradients in observed fields, is computationally efficient, and capable of updating forecast guidance in the near term.

E N D
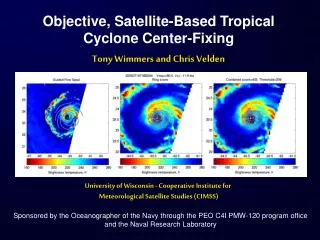
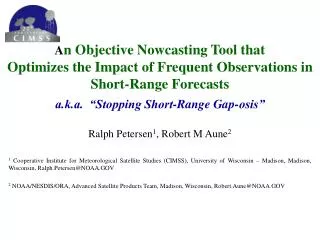
A Satellite-Based Objective Analysis Scheme for Nowcasting Applications Robert M. Aune Advanced Satellite Products Team NOAA/NESDIS/ORA/ARAD and Ralph Petersen Cooperative Institute for Meteorological Satellite Studies University of Wisconsin, Madison Analysis of Record Workshop USWRP June 29 - 30, 2004
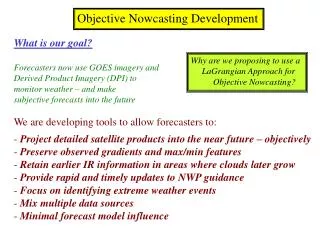
Project Goals Develop an objective analysis system for nowcasting that leverages the temporal and spatial attributes of the GOES sounder Desired attributes: 1) Observation based, i. e. minimal dependence on forecast models 2) Give priority to preserving vertical and horizontal gradients in the observed fields with the goal of detecting extreme variations in atmospheric parameters and identifying the onset of significant weather events 3) Computationally efficient to allow fast dissemination 4) Be capable of updating forecast guidance in the near term
Observation-based Analysis Versus Numerical Prediction System Numerical Prediction Systems: - Do not guarantee accurate analyses of atmospheric parameters - Initial model fields frequently contain unrepresentative horizontal and vertical gradients with reduced maxima and minima. - Uses optimal statistical approaches to extract information from observations by fitting the model variables to the observations in a least-squared sense across three space dimensions over a discrete time intervals (computationally intensive) - Absolute accuracy is sacrificed to achieve the best overall spatial fit that satisfies the model physics, dynamics and numerics - Information previously introduced (maxima and minima) is lost due to imperfections in the analysis and/or the prediction model.
Observation-based Analysis Versus Numerical Prediction System Observation-based Analysis: - horizontal and vertical gradients, and local maxima and minima are preserved - preserve absolute accuracy - computationally efficient - requires observations at high spatial and temporal resolutions, and effective quality control
We are currently testing a system that uses a LaGrangian approach to optimize the retention of information provided by the GOES sounder. Tests with real data are currently being conducted using full resolution (12 km) derived layer moisture products from the GOES-12 sounder over an area in the Central U.S. These tests focus on the ability of the proposed system to retain and capture details important to the development of convective instability. The advantages of using a LaGrangian to updating short-range model guidance will be demonstrated for conditions that are dominated by differential advection.
GOES Sounder provides information at 19 Spectral Bands (14.7 to 3.7 um and visible) hourly at ~10 km spacing
Benefits of single field-of-view (FOV) processing 5x5 FOV: ~50km 3x3 FOV: ~30km Single FOV: ~10km
Processing of GOES sounder data has increased by a factor of ~15.
Satellites are becoming “more mesoscale” 3 by 3 FOVs for GOES 1 by 1 FOVs for GOES 5 by 5 FOVs for MODIS
High spatial coverage of observations is crucial. Observational coverage provided by the GOES sounder is enhanced by projecting observations forward in time along trajectories using: - kinematic trajectories using analyzed wind fields - pressure gradient trajectories using heights du/dt = - g dz/dx + f v dv/dt = - g dz/dy + f u
700 hPa mixing ratios from GOES-8 valid 12 UTC projected forward in time and compared with corresponding GOES retrievals. initial +3 hours Fits remain good through 3 hours. Biases increase after that, especially at low levels where diurnal effects are large. +6 hours
3x3 GOES sounder observations projected forward 3 hours at three levels track differently due to wind shear.
Statistics comparing trajectory observations to actual equivalent potential temperature (K) retrievals from GOES-8.
Gridding of observations is performed using a recursive filter (Hayden and Purser, 1995) - empirical linear interpolation - does not use knowledge of model or observational error - extremely fast Form A’i = aA’i-1 + (1 – a)Ai, 0<a<1 Forward filter bias is removed by using “adjoint filter” A’i = (1 – a)(Ai + aAi-1 + . . . . . aj Ai-j + ...) Applies locally varying scaling and QC Can be applied to limited area
GOES-12 nowcasting test domain – 10km
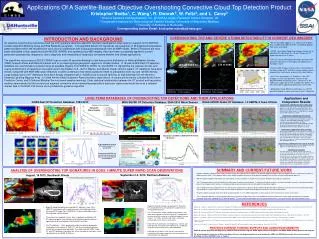
An Example of the Trajectory Analysis Approach The following sequence is an example of how the trajectory observations can be used to augment an analysis of precipitable water (PW) retrieved from the GOES-12 sounder. The analysis is performed hourly using observations at T-3, T-2, and T-1 starting at 09 UTC and ending at 15 UTC. The resulting analysis at 15 UTC is then projected forward 3 hours to produce a nowcast of PW.
Initial analysis of GOES-12 level 2 (.9σ-.7σ) PW valid 09UTC 04Nov03 Upper left is corresponding GOES sounder image. Observation fit is shown at right
Analysis of GOES-12 level 2 (.9σ-.7σ) PW valid 12UTC 04Nov03 after four analysis updates Upper left is corresponding GOES sounder image. Observation fit is shown at right
Analysis of GOES-12 level 2 (.9σ-.7σ) PW valid 15UTC 04Nov03 after seven analysis updates Upper left is corresponding GOES sounder image. Observation fit is shown at right
3-hour nowcast of GOES-12 level 2 (.9σ-.7σ) PW valid 18UTC 04Nov03 after seven analysis updates Upper left is corresponding GOES sounder image. Observation fit is shown at right
Future Issues Future meteorologists will have up to the minute access to digital atmospheres that will be as accurate, as the observations used to build it. The quantity of information defining the physical and dynamical state of our atmosphere, collected in near real time, will become unmanageable; the vast majority of these observations will come from remote sensing platforms. An observation-based analysis system could serve as an intelligent data compression tool, generating detailed analyses that can be readily transmitted to nowcasters in the field. Visualization of these data will be also an important issue.
Further Reading Browning, K. A., editor, 1982: Nowcasting. Academic Press, 256pp. Daley, R., 1991: Atmospheric data analysis. Cambridge Atmospheric and Space Science Series. Cambridge University Press, 457pp. Hayden, C. and J. Purser, 1995: Recursive filter objective analysis of meteorological fields: Applications to NESDIS operational processing. J. Appl. Meteor., 34, 3-15. Menzel, W. P., F. Holt, T. Schmit, R. Aune, A. Schreiner, G. Wade, and D. Gray, 1998: Application of GOES-8/9 soundings to weather forecasting and nowcasting. Bull. Amer. Meteor. Soc., 79, 2059-2077.
1) What can be learned from the literature and applications of existing methodologies as far as benefits and limitations of a particular approach that you may be advocating for an analysis of record? 2) What are the critical issues that must be faced in order to successfully develop a quality analysis of record at spatial scales of 2.5-5 km every hour? 3) Are there some aspects of an analysis of record effort that are more straightforward to accomplish than others, i.e., specific variables (temperature vs. precipitation), real-time analyses vs. retrospective analyses?
4) To what extent will the analysis of record be constrained by limitations of the existing and future observational data base vs. that available in the past? What observational data sets do you view to be most critical? 5) To what extent will the analysis of record be constrained by limitations of an underlying model? Sensitivity to boundary layer parameterizations, soil moisture, clouds, etc.? 6) What are appropriate measures of the skill of an analysis of record on these spatial and temporal scales? 7) What are the resource implications of a particular method? Computational costs? R&D costs? Ball park numbers on costs are more than adequate. Keep in mind that no funds have been committed yet to support the development of an analysis of record.
Analysis of Record • Issues: • Funding to support 30 minute latency • Proprietary datasets • Do we impose a wind – mass balance • How do we validate the AOR? • How can satellite data contribute? • How can satellite data benefit from the AOR?