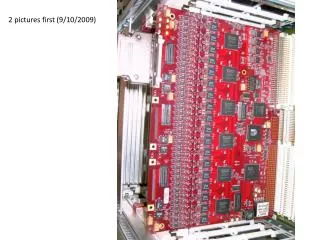
2 pictures first (9/10/2009)
70 likes | 183 Vues
This document details the first data from the ADC125 module and its interaction with the GAS-1/GPC-01 setup, recorded on 9/10/2009. The measurements, conducted without cable installation, indicate an output range of 0-16384 (14 bits) with manageable noise levels. It also discusses potential adjustments to the ADC125 component values and emphasizes the significance of digital signal processing to mitigate undesired signal tails. Additionally, the report includes insights on bandwidth and timing resolution improvements based on observed noise spectra.

2 pictures first (9/10/2009)
E N D
Presentation Transcript
First data from ADC125 module 8/24/2009 Input Mainboard only
Output Peaking here is designed/desired (cable response equalization). Keep in mind there is no cable installed in this measurement. Note: Range is 0-16384 (14 bits), two LSB are zero here (a 12 bit assembly)
Output noise level (open input) σ=2.20 (as 12-bit: σ=0.55)
Connector assembly problem corrected; first data from preamp & ADC125 together 9/10/2009 • Don’t worry about the tail: • ADC125 component values to be adjusted, when • final preamp • final cable length • also we can cancel the tail digitally in the FPGA Combined response of GAS-1/GPC-01, cable, and ADC125 to 94 electron x 5x10⁴ signal with t0=1.38 ns Input pulse through capacitor to GAS-1 (top is detail) See GlueX-doc-931-v2 for details (same setup used here) About 20% of full scale range
Combined response of GAS-1/GPC-01, cable, and ADC125 Single 4096-point acquisition noise spectrum (no averaging) • The overall structure is as expected from the preceeding pulse plot… 3 points on the leading edge implies that the bandwidth is ≈1/3 Nyquist. • But here you can see that there really is insignificant noise above the cutoff frequency ≈25 MHz • So all the waveform information is present in the digital data – the algorithms have a chance • My opinion is that this is a bit too conservative: want to raise the bandwidth by 20-30% here, will improve timing resolution w/o any noticeable compromise to charge resolution • Or we can drop the sample rate and hence the raw data volume • Also: hard to draw conclusions yet w/o averaging, but no anomalous peaks are seen here – no EMI issues (on lab bench)