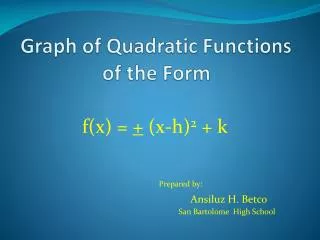
Graph of quadratic functions
390 likes | 1.25k Vues
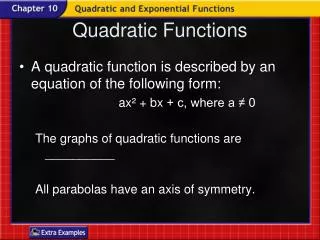
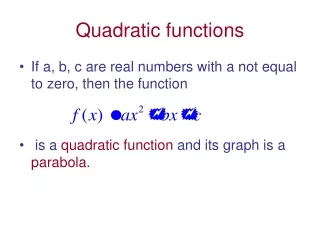
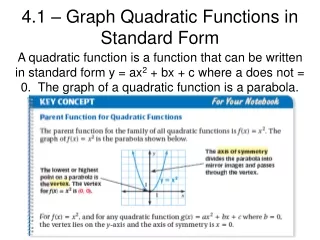
Graph of quadratic functions. We start with a simple graph of y = x 2. Important features. It is shaped. It is symmetrical about a line x = 0 (i.e. y axis). It has a vertex at (0,0) (i.e. the minimum point). y. y = x 2. x. Vertex(0, 0). Graph of quadratic functions.

Graph of quadratic functions
E N D
Presentation Transcript
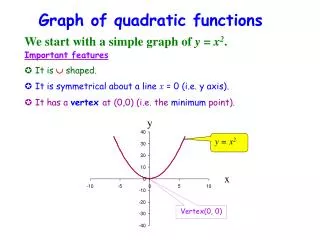
Graph of quadratic functions We start with a simple graph of y = x2. Important features It is shaped. It is symmetrical about a line x = 0 (i.e. y axis). It has a vertex at (0,0) (i.e. the minimum point). y y = x2 x Vertex(0, 0)
Graph of quadratic functions By changing the equation slightly, we can shift the curve around without changing the basic shape. The graph of y = x2 + 5 can be obtained by translating the graph of y = x2 five units in the y-direction. y y = x2 + 5 x Vertex (0, 5)
y x Graph of quadratic functions The graph of y = x2 – 10 can be obtained by translating the graph of y = x2ten unitsin the negative y direction. y = x2 - 10 Vertex (0, -10)
Graph of quadratic functions I we replace x by x – k in the equation of a graph then the graph produces a translation of k units in the x direction. The graph of y = (x – 2)2 can be obtained by translating the graph of y = x2 two units in the x direction. y y = (x – 2)2 x Vertex (2, 0)
Graph of quadratic functions In a similar fashion, the graph of y = (x + 4)2 is a shift of – 4 in the x-direction, the vertex is at (-4, 0). y y = (x + 4)2 x Vertex (-4, 0)
Graph of quadratic functions We start with a simple graph of y = -x2 Important features It is shaped. It is symmetrical about a line x = 0 (i.e. y axis). It has a vertex at (0,0) (i.e. the maximum point). y Vertex(0, 0) x y = - x2
y x Graph of quadratic functions We can also have combinations of these transformations: The graph of y = (x – 2)2 – 10 has a shift of 2 units in the x-direction and –10 in the y-direction, with minimum point at (2, -10). y = (x – 2)2 - 10 Vertex (2, -10)
Use of the discriminant b2 – 4ac The discriminat of the quadratic function y = ax2 + bx + c is the value of b2 – 4ac. Discriminat b2 – 4ac > 0 b2 – 4ac = 0 b2 – 4ac < 0 Number of roots: twoone None Intersection with the x-axis Two pointsTouch at one pointDo not meet Sketch a >0 Sketch a < 0