OXYHEMOGLOBIN DISSOCIATION CURVE
OXYHEMOGLOBIN DISSOCIATION CURVE. Chemeketa Community College. Oxyhemoglobin Dissociation Curve. Mathematically equates the percentage saturation of hemoglobin to the partial pressure of oxygen in the blood. Oxygen hemoglobin dissociation curve. Oxy/hemo Curve.

OXYHEMOGLOBIN DISSOCIATION CURVE
E N D
Presentation Transcript
OXYHEMOGLOBIN DISSOCIATION CURVE Chemeketa Community College
Oxyhemoglobin Dissociation Curve Mathematically equates the percentage saturation of hemoglobin to the partial pressure of oxygen in the blood
Oxy/hemo Curve • The ability of oxygen to bind with and dissociate from hemoglobin • How shifts change affinity
Oxy/hemo Curve • 97% O2 on Heme of Hgb • 3% in plasma • 3% is available in anemia • Harmful in toxicity
Oxy/hemo Curve • O2 is “loosely” attached to heme • Easily formed and dissolved
Oxy/hemo Curve • Heme can carry 4 O2 molecules • Each site is affected by the other 3 • As they bind, space is decreased
Oxy/hemo Curve • The more they bind, the easier it becomes to bind
Oxy/hemo Curve • Two transfer sites exist • Alveolar-capillary site • Capillary-tissue site
O2 Saturation Monitoring • ABGs, pulse oximetry • Venous sats
O2 Sat. Monitoring • Does not tell tissue oxygenation • Patient may have tissue hypoxia in spite of monitors
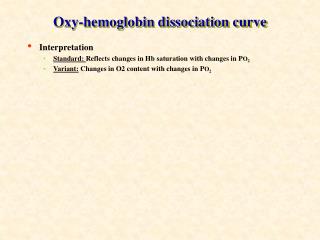
Oxy/hemo Curve • Normal curve uses O2 Sats and PaO2 to reflect amount of oxygen available to the tissues
Oxy/hemo Curve-Normals • 37 degrees, pH 7.40, PaCO2 40 mm/hg • Deviation causes a shift
Oxy/hemo Curve • Upper-flat portion is lungs • Steep portion is tissues • Body can hold 96-97% down to 80 mm/hg
Oxy/hemo Curve • Results of tissue transfer- • Venous blood at 63% • At 27 mm/hg the Sat is 50%
Changes in Affinity • pH, PaCO2, carbon monoxide, abnormal Hgb., temp, intracellular compounds, 2,3-DPG
The Bohr effect • Oxygenated Hgb = stronger acid than deoxygenated Hgb • Change in pH facilitates release of oxygen
The Bohr effect • Acid becomes weaker • Blood picks up CO2 • Transports to lungs and process reverses
Temperature • Decrease causes increased affinity • Shift to left • Increase causes decreased affinity • Shift to right
2,3 DPG (diphosphoglycerate) • An enzyme that affects binding directly • Competes with oxygen
2,3 DPG (diphosphoglycerate) • More 2,3 DPG =decreased affinity • Less = increased affinity
Carbon Monoxide (CO) • CO has > 200 times greater affinity than oxygen • Always causes lower oxygen sats
Abnormal Hemoglobin • May have greater or lesser affinity
Left Shift • Increased affinity for O2 • At any PaO2, % is higher
Left Shift • Easier to “hook-on” • Harder to “un-hook”
Left Shift-clinical situations • Alkalosis, hypocapnia, hypothermia • Decreased DPG, CO poisoning • Blood transfusion, fetal Hgb
Clinical example • 56 yo woman with ICP elevated • Craniotomy for CVA bleed/ aneurysm • Hyperventilated to vasoconstrict
Her ABGs • pH = 7.53, Pa CO2 = 21 mm/hg • PO2 = 118 mm/hg, HCO3 = 17.8 mEq/L • O2 Sat = 99.1%, Temp =37.6
What does it mean? • Left shift makes it hard to “un-hook” • Tissue hypoxia must be watched for, even if readings indicate high sats
Right shift • Decreased affinity for O2 • At any PO2, sat % is decreased • Harder to “hook-on” • Easy to “un-hook”
Clinical situations • Acidosis, hypercapnia, hyperthermia • Elevated DPG • Hyperthyroidism, anemia, chronic hypoxia
Clinical example • 25 yo with ARDS • Secondary to staph pneumonia • 100% O2, PPV
ABGs • pH = 7.27, PaCO2 = 51.2 mm/hg • PO2 = 40 mm/hg, HCO3 = 23.6 mEq/L • O2 Sat = 76.2%, Temp =39.7
Clinical example • Right shift is protective if additional O2 is given
Summary • The curve helps us appreciate factors that affect the oxygenation status of critical patients. • http://www.ventworld.com/resources/oxydisso/oxydisso.html • http://en.wikipedia.org/wiki/Arterial_blood_gas
Summary • Diseases or treatments shift the curve • Understanding allows for more appropriate interventions