Download
1 / 46
460 likes | 620 Vues
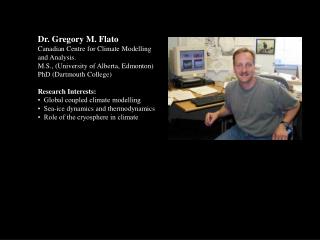
Dr. Gregory M. Flato Canadian Centre for Climate Modelling and Analysis. M.S., (University of Alberta, Edmonton) PhD (Dartmouth College) Research Interests: • Global coupled climate modelling • Sea-ice dynamics and thermodynamics • Role of the cryosphere in climate.

E N D
Dr. Gregory M. FlatoCanadian Centre for Climate Modelling and Analysis. M.S., (University of Alberta, Edmonton)PhD (Dartmouth College)Research Interests:• Global coupled climate modelling• Sea-ice dynamics and thermodynamics• Role of the cryosphere in climate
The Arctic in Global Climate Models and Projections of Future Change Gregory M. Flato Canadian Centre for Climate Modelling and Analysis Meteorological Service of Canada
Outline • Arctic climate and its variability • Global climate models • Representation of Arctic climate and climate processes in global models • Projections of future climate change • Summary
Arctic Climate Observed Surface Temperature (oC) Winter Annual Mean temperature anomaly Time series: 1850-present Jones and Moberg (2003) Fyfe (2004) Based on NCEP Reanalysis
Atmospheric Circulation Mean Sea-Level Pressure (hPa) Winter Summer Fyfe (2004)
Sea-Ice Circulation International Arctic Buoy Program
Variations in transport, deformation, growth and melt all contribute to observed variability and recent decline in ice coverage. Courtesy of J. Walsh, U. Illinois.
Transport of ice is balanced by net growth or melt. • the associated salt or freshwater fluxes impact ocean mixing and circulation. Courtesy of M. Hilmer, IfM, Kiel
Ocean Circulation Surface layer Atlantic layer Jones (2001)
There are many important feedbacks and connections between these climate components in the Arctic. • A model provides a framework for synthesizing our understanding of this complex system, and provides a tool for making quantitative projections of future change. • However, the Arctic is part of, and interacts with, the global climate system, so it can’t be considered in isolation.
Global Climate Models • Based on laws of physics • Mathematical representation of • 3-D atmosphere: its temperature, humidity, wind, radiative transfer, cloud formation/dissipation, precipitation, … • 3-D ocean: its temperature, salinity, circulation, mixing, … • Sea-ice: its formation, melt, motion and deformation. • Land surface: its temperature, moisture content, reflectivity, evapotranspiration, …
A recent trend is to make use of alternate grid configurations to better resolve ocean (and ice) processes in the Arctic. These examples are from the POP ocean code, used in the NCAR community climate model. http://climate.lanl.gov/Models/POP/index.htm The equations are solved numerically on a discrete grid. A problem peculiar to the Arctic is the convergence of meridians at the North Pole – this causes numerical difficulties, particularly in the ocean model.
Model Intercomparison Projects • There are perhaps 15 or so global climate models under development around the world. • Intercomparison projects provide an opportunity to: • evaluate models in a systematic fashion; • compare/contrast results from different models; • and hopefully, to identify reasons for the differences.
Global Climate Models of the mid 1990s Flato (2004) Motionless ice with a prognostic equation for ice growth and melt. 2 Prognostic equations for growth/melt and ice motion, including representation of internal ice stress. 3 Prognostic equation for ice growth/melt, ice motion diagnosed as a function of ocean surface current.
One can look at ensemble mean quantities, or look at individual models … IPCC (2001)
Intermodel standard deviation of surface air temperature (oC) Model disagreement is largest over area influenced by sea ice. Just as sea-ice feedbacks amplify climate change, they also amplify model errors and contribute to uncertainty in projections of future climate. based on CMIP archive data
MSLP ensemble mean error Atmosphere-only models Coupled models Walsh et al. (2002)
Annual Mean Sea-Level Pressure CCCma CGCM2 NCEP Reanalysis
Modelled ice extent in the 12 model CMIP ensemble 10% of models have less ice than this. Median ice edge. 10% of models have more ice than this. Interestingly, median model ice edge agrees well with observations. Flato, 2004
Snow cover ‘error’ in AMIP1 models (early 1990s) Frei and Robinson, 1998 Snow cover ‘error’ in AMIP2 models (late 1990s) Frei et al., 2003
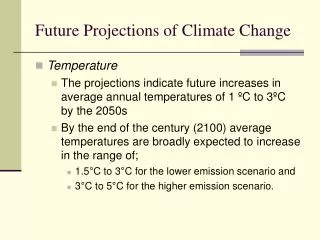
Concentration (ppmv) Projections of future change • Coupled models are forced with GHG and aerosol forcing as observed from 1850 to the present, then increasing as per some prescribed future scenario.
Projected Surface Air Temperature Change – 2050 vs 1980 CCCma CGCM2 -- Mean = 1.92oC
Observations CCCma Model 1946-56 1986-96 One can compare the evolution of temperature anomalies over time …
Projected climate warming is enhanced over sea ice; as in the case of ‘control’ climate, this is also the location of largest disagreement. (But all models predict warming) NH ensemble mean temperature change (C) NH intermodel standard deviation (C) Based on CMIP archive
Walsh observations Both models underestimate ice extent somewhat. CCCma model indicates more rapid historical and future decline – not inconsistent with observed decline. Predictions of sea-ice changes likewise vary from model to model. Here we show NH annual mean ice extent from CCCma and Hadley Centre models.
thermo-only dynamic (rheology) no flux-adj. flux adj. dynamic (drift) diagnostic NH Ice Extent and its Change – CMIP2 model ensemble (CO2 increased at 1% per year for 80 years – the time of doubling Initial Ice Extent Ice Extent Change No obvious connection between error and ice model characteristics But all models predict a decline Flato, 2004
Summary • Feedbacks involving the cryosphere lead to amplification of projected climate warming in the Arctic. • These feedbacks also amplify model errors • Although global climate models are improving, the Arctic remains a challenge. • Model errors tend to be larger than elsewhere. • Nevertheless, models universally agree that climate change will be larger in the Arctic than at lower latitudes. • The last decade has seen an increased focus on modelling Arctic climate. • Various intercomparison projects yield quantitative evaluation of model shortcomings. • Representation of snow in climate models has improved demonstrably. • More sophisticated sea-ice models are being employed, and alternative grid configurations are being used to improve resolution of Arctic ice and ocean processes.
Model projection of change in permafrost Stendel and Christensen, 2002
The ‘Arctic Oscillation’ Sea-Level Pressure Temperature Figures courtesy J. Fyfe
CCCma CGCM1 Fyfe et al., 1999 Observed Fyfe, 2004
Arctic Oscillation Climate change scenario CCCma model Fyfe et al., 1999 Observations to 2002 Stratosphere included GISS model Shindell et al., 1999 No Stratosphere
900-year time series of NH ice extent from CCCma climate model
Likelihood of observed trends based on 5000 yr control run of GFDL model Recent trend is not likely a result of natural variability … 1978-98 trend (p < 2%) 1953-98 trend (p <0.1%) Vinnikov et al. (1999)
There is substantial interannual variability in Fram Strait outflow, but no obvious trend. • Correlation with NAO is strong (r=0.7) for the period 1978-1997, but weak (r=0.1) for ‘58-’77 period. Hilmer and Jung (2000).
Observations are insufficient to say much about ice thickness variability, but model results give some indication. • Variability is expected to be large near coastlines, due to wind-driven deformation.
Submarine observations do provide some evidence for long-term change in thickness. • 40% decrease between 1958-1976 and 1993-1997. Rothrock et al., 1999
However, model results indicate that wind-driven changes in thickness build-up pattern, and limited sampling, may be important. Holloway and Sou, 2002
Thickness change by middle of 21st century CCCma Hadley Hadley CCCma
CCCma model projects seasonal Arctic ice cover by mid century. March September 1971-1990 2041-2060
Ensemble mean thickness Intermodel standard deviation
Composite results for Southern Hemisphere. 10 model ensemble
Ensemble mean thickness Intermodel standard deviation JJA