Download
1 / 24
240 likes | 458 Vues
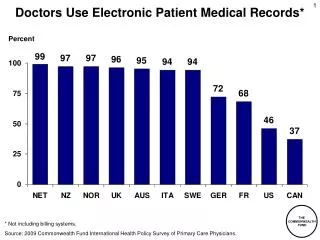
Doctors Use Electronic Patient Medical Records*. Percent. * Not including billing systems. Source: 2009 Commonwealth Fund International Health Policy Survey of Primary Care Physicians. Doctors Use Electronic Patient Medical Records in Their Practice, 2006 and 2009*. Percent.

E N D
Doctors Use Electronic Patient Medical Records* Percent * Not including billing systems. Source: 2009 Commonwealth Fund International Health Policy Survey of Primary Care Physicians.
Doctors Use Electronic Patient Medical Recordsin Their Practice, 2006 and 2009* Percent * 2006: “Do you currently use electronic patient medical records in your practice?” * 2009: “Do you use electronic patient medical records in your practice (not including billing systems)?” Source: 2006 and 2009 Commonwealth Fund International Health Policy Survey of Primary Care Physicians.
Practice Use of IT on a Routine Basis for Core Tasks Source: 2009 Commonwealth Fund International Health Policy Survey of Primary Care Physicians.
Computerized Capacity to Generate Patient Information * Including those that may be prescribed by other doctors. Source: 2009 Commonwealth Fund International Health Policy Survey of Primary Care Physicians.
Doctor Routinely Receives Reminders for Guideline-Based Interventions or Screening Tests Percent 73 72 54 49 47 39 27 21 16 16 10 Percentages may not sum to totals because of rounding. Source: 2009 Commonwealth Fund International Health Policy Survey of Primary Care Physicians.
Practice Routinely Sends Patients Reminders for Preventive or Follow-Up Care Percent 97 97 89 80 60 51 47 33 32 31 15 Percentages may not sum to totals because of rounding. Source: 2009 Commonwealth Fund International Health Policy Survey of Primary Care Physicians.
Practices with Advanced Electronic Health Information Capacity Percent reporting at least 9 of 14 clinical IT functions* * Count of 14 functions includes: electronic medical record; electronic prescribing and ordering of tests; electronic access test results, Rx alerts, clinical notes; computerized system for tracking lab tests, guidelines, alerts to provide patients with test results, preventive/follow-up care reminders; and computerized list of patients by diagnosis, medications, due for tests or preventive care. Source: 2009 Commonwealth Fund International Health Policy Survey of Primary Care Physicians.
Doctors’ Perception of Patient Access Barriers Source: 2009 Commonwealth Fund International Health Policy Survey of Primary Care Physicians.
Insurance Restrictions on Medication or Treatment for Patients Pose Major Time Concerns for Doctors Percent saying amount of time physician or staff spend getting patients needed medications or treatment due to coverage restrictions is a MAJOR PROBLEM Source: 2009 Commonwealth Fund International Health Policy Survey of Primary Care Physicians.
Practice Has Arrangement for Patients’ After-Hours Care to See Doctor/Nurse Percent Source: 2009 Commonwealth Fund International Health Policy Survey of Primary Care Physicians.
Practice Routinely Uses Written Treatment Guidelines, by Condition Diabetes Depression Percent Percent Source: 2009 Commonwealth Fund International Health Policy Survey of Primary Care Physicians.
Doctor Routinely Gives Chronically Ill Patients Written Instructions on Managing Care at Home Percent saying yes, ROUTINELY gives written instructions Source: 2009 Commonwealth Fund International Health Policy Survey of Primary Care Physicians.
Practice Routinely Gives Patients Written List of All Medications Percent saying yes, ROUTINELY gives list of all medications Source: 2009 Commonwealth Fund International Health Policy Survey of Primary Care Physicians.
Practices Use Nonphysician Clinical Staff for Patient Care Percent reporting practice shares responsibility for managing care, including nurses, medical assistants Source: 2009 Commonwealth Fund International Health Policy Survey of Primary Care Physicians.
Does Your Practice Have a Process for Identifying Adverse Events and Taking Follow-Up Action? Source: 2009 Commonwealth Fund International Health Policy Survey of Primary Care Physicians.
Practice Routinely Receives and Reviews Data on Patient Clinical Outcomes Percent Source: 2009 Commonwealth Fund International Health Policy Survey of Primary Care Physicians.
Practice Routinely Receives and Reviews Data on Patient Satisfaction and Experience Percent Source: 2009 Commonwealth Fund International Health Policy Survey of Primary Care Physicians.
Practice Routinely Receives Data Comparing Clinical Performance to Other Practices Percent * Question asked differently in Italy. Source: 2009 Commonwealth Fund International Health Policy Survey of Primary Care Physicians.
Time Spent Reporting or Meeting Regulations Is a Major Problem Percent said amount of time spent reporting clinical information or meeting regulatory requirements is a MAJOR PROBLEM Source: 2009 Commonwealth Fund International Health Policy Survey of Primary Care Physicians.
Financial Incentives and Targeted Support * Including bonuses, special payments, higher fees, or reimbursements. ** Including patient counseling or group visits. *** Question not asked in Italy survey. Source: 2009 Commonwealth Fund International Health Policy Survey of Primary Care Physicians.
Doctors Can Receive Any Financial Incentives Percent who can receive any financial incentives for targeted care or meeting goals* * Can receive financial incentives for any of six: high patient satisfaction ratings, achieve clinical care targets, managing patients with chronic disease/complex needs, enhanced preventive care (includes counseling or group visits), adding nonphysician clinicians to practice and non-face-to-face interactions with patients. Italy not asked non-face-to-face. Source: 2009 Commonwealth Fund International Health Policy Survey of Primary Care Physicians.
Physician Views of Health System * Respondents asked which statement expresses their overall view of their country’s health system: only minor changes are needed; fundamental changes are needed; system needs to be completely rebuilt. Source: 2009 Commonwealth Fund International Health Policy Survey of Primary Care Physicians.
Physician Satisfaction with Practicing Medicine Percent* * The other responses were somewhat dissatisfied or very dissatisfied. Source: 2009 Commonwealth Fund International Health Policy Survey of Primary Care Physicians.
Physician Views of the Quality of Care Their Patients Get Throughout the Health Care System Source: 2009 Commonwealth Fund International Health Policy Survey of Primary Care Physicians.