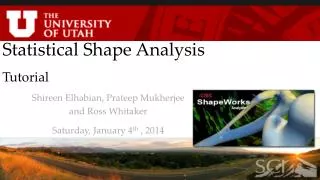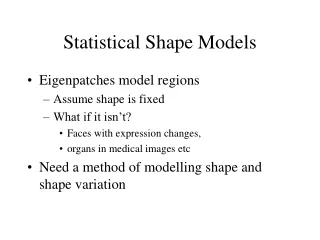
Statistical Shape Analysis
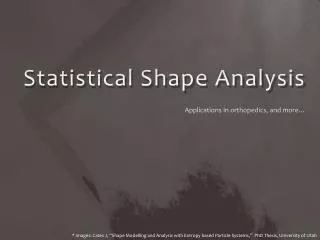
Statistical Shape Analysis. Applications in orthopedics, and more…. * Images: Cates J, “Shape Modelling and Analysis with Entropy based Particle Systems,” PhD Thesis, University of Utah. Study of ‘Shape’ What questions can it answer ? *. Genetics

Statistical Shape Analysis
E N D
Presentation Transcript
Statistical Shape Analysis Applications in orthopedics, and more… * Images: Cates J, “Shape Modelling and Analysis with Entropy based Particle Systems,” PhD Thesis, University of Utah
Study of ‘Shape’ What questions can it answer ?* Genetics How does a gene mutation change skeletal development in mice? Anthropology & Evolutionary Biology How does bone shape vary in a fossil record? Is the shape of a given bone a good classifier for species? Neuroanatomy Is there a difference in the shape of brain structures between schizophrenic and normal populations? Biomechanics What is the normal covariation in shape of structures of the hip joint? How does it change as a function of age?
Statistical Shape Analysis It’s all about representation… Given a collection of shapes, we can use a point based representation for each Si BUT… How do we choose the “same” points ??
Point Correspondence ModelBalancing accuracy vs. low variance Shape Representation* Shape Correspondence* Shape Space (dM-dim): Si -> single point ! Configuration Space (d-dim)Si-> (xi1 , …, xi2M) xi -> d-dimensional point Trade off: accurate sampling vs. compact model
FAI Characterization†Dr. Jeffery Weiss, Dr. Andrew Anderson, clinicians @ OrthopedicsDepartment of Orthopedics, University of Utah Objective: quantify 3D variation and morphologic differences between control and cam femurs Fig: Radiographs of subjects with healthy (left) and cam FAI (right) femurs. Circles indicate the anterolateral head-neck junction. †MD Harris, M Datar, E Jurrus, CL Peters, RT Whitaker, AE Anderson, "Statistical Shape Modeling of CAM-type Femoroacetabular Impingement CMBBE 2012
FAI Characterization†Dr. Jeffery Weiss, Dr. Andrew Anderson, clinicians @ OrthopedicsDepartment of Orthopedics, University of Utah • Segmented femurs from controls (33) and patients(15) with CAM-FAI • Statistically significant group differences (p-value < 0.01) • Mean shape deviations between control and CAM groups most pronounced at the anterolateral head-neck junction (max = 2.7mm) Fig: Two views (two rows) of the mean control (left) and cam (right) shapes.Mean control shape (center), color coded to depict shape differences in comparison with mean CAM shape †MD Harris, M Datar, E Jurrus, CL Peters, RT Whitaker, AE Anderson, "Statistical Shape Modeling of CAM-type Femoroacetabular Impingement CMBBE 2012
FAI Characterization†Dr. Jeffery Weiss, Dr. Andrew Anderson, clinicians @ OrthopedicsDepartment of Orthopedics, University of Utah Consistent differences captured by individual modes for control and CAM groups Fig: Mean shapes (μ) for both groups and shapes at ±3 standard deviations for the first 3 modes †MD Harris, M Datar, E Jurrus, CL Peters, RT Whitaker, AE Anderson, "Statistical Shape Modeling of CAM-type Femoroacetabular Impingement CMBBE 2012
Mouse Model of OsteochondromaDr. Kevin Jones, M.D., clinicians @ Huntsman Cancer InstituteDepartment of Orthopedics and Huntsman Cancer Institute, University of Utah • Individuals with multiple osteochondromas (MO) demonstrate shortened long bones. Possible reason: steal phenomenon • Segmented bones (femur, tibia+fibula) from mice, genetically altered to inflict osteochondroma at various stages in time Histopathology image of MO in mice bone Segmented femur and tibia+fibula used in study MO in human bone
Mouse Model of OsteochondromaDr. Kevin Jones, M.D., clinicians @ Huntsman Cancer InstituteDepartment of Orthopedics and Huntsman Cancer Institute, University of Utah • Statistically significant group differences (individual p-values < 0.01) • Correlation with length evident visually in the group means Next step: Directional analysis Fig: Group mean differences for femur Fig: Group mean differences for tibia+fibula Color code: expansion (blue) or contraction (yellow) w.r.t normal
Mouse Model of OsteochondromaDr. Kevin Jones, M.D., clinicians @ Huntsman Cancer InstituteDepartment of Orthopedics and Huntsman Cancer Institute, University of Utah • Gives visual indication of the steal phenomenon, with: • Tangential deformation in most areas of the mean shape, leading to shortening in length • Orthogonal deformation near “bumps”, leading to local increase in girth Next step: Quantifying differences for individual subjects Fig: Directional analysis for femur Fig: Directional analysis for tibia+fibula Arrows show local deformation from mean-normal to mean-mutant shape
ShapeWorks Pipeline Optimization Visualization Preprocessing
Thank you ! Questions ?