Download
1 / 8
100 likes | 410 Vues
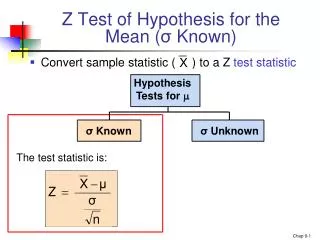
Z Test of Hypothesis for the Mean ( σ Known). X. Convert sample statistic ( ) to a Z test statistic. Hypothesis Tests for . σ Known. σ Unknown. The test statistic is:. Critical Value Approach to Testing. For two tailed test for the mean, σ known:

E N D
Z Test of Hypothesis for the Mean (σ Known) X • Convert sample statistic ( ) to a Z test statistic Hypothesis Tests for σ Known σ Unknown The test statistic is:
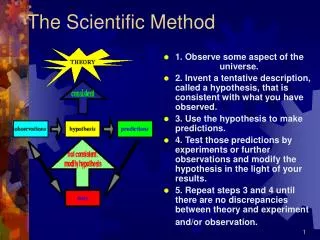
Critical Value Approach to Testing • For two tailed test for the mean, σ known: • Convert sample statistic ( ) to test statistic (Z statistic ) • Determine the critical Z values for a specifiedlevel of significance from a table or computer • Decision Rule: If the test statistic falls in the rejection region, reject H0 ; otherwise do not reject H0
Two Tailed Tests H0: μ = 3 H1: μ¹ 3 • There are two cutoff values (critical values), defining the regions of rejection /2 /2 X 3 Reject H0 Do not reject H0 Reject H0 Z -Z +Z 0 Lower critical value Upper critical value
One Tail Tests • In many cases, the alternative hypothesis focuses on a particular direction This is a lower tail test since the alternative hypothesis is focused on the lower tail below the mean of 3 H0: μ≥ 3 H1: μ < 3 This is an upper tail test since the alternative hypothesis is focused on the upper tail above the mean of 3 H0: μ≤ 3 H1: μ > 3
Lower Tail Tests H0: μ≥ 3 H1: μ < 3 • There is only one critical value, since the rejection area is in only one tail a Reject H0 Do not reject H0 Z -Z 0 μ X Critical value
Upper Tail Tests H0: μ≤ 3 H1: μ > 3 • There is only one critical value, since the rejection area is in only one tail a Do not reject H0 Reject H0 Z Zα 0 μ X Critical value
Level of Significance, • Defines the unlikely values of the sample statistic if the null hypothesis is true • Defines rejection region of the sampling distribution • Is designated by , (level of significance) • Typical values are .01, .05, or .10 • Is selected by the researcher at the beginning • Provides the critical value(s) of the test
Level of Significance and the Rejection Region a Level of significance = Represents critical value a a H0: μ = 3 H1: μ≠ 3 /2 /2 Rejection region is shaded Two tailed test 0 H0: μ≤ 3 H1: μ > 3 a 0 Upper tail test H0: μ≥ 3 H1: μ < 3 a Lower tail test 0