
SlideServe
Menu
Préférences
© SlideServe · v2026

Plastic Recycling Update

nevaeh avatar
11 diapositives · 380 Views · Oct 25, 2014

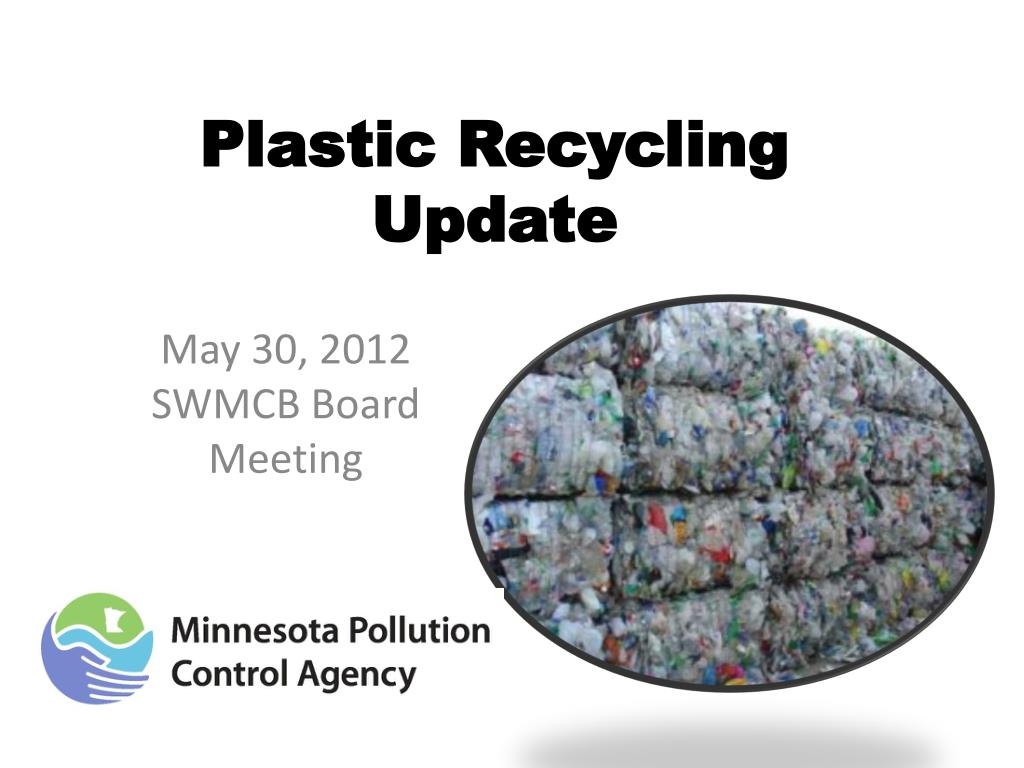
Plastic Recycling Update. May 30, 2012 SWMCB Board Meeting. US EPA 2010 Waste Characterization Study. Plastics made up 12.4 percent of all municipal solid waste before recycling. Over 31 million tons of plastic was generated in 2010, compared to just 390,000 tons in 1960.
Plastic Recycling Update - slide 1
01 / 11Plastic Recycling Update
1 / 17

Télécharger la présentation

Plastic Recycling Update
Une image / un lien ci-dessous est fourni (tel quel) pour télécharger la présentation

Politique de téléchargement : le contenu du site vous est fourni TEL QUEL pour votre information et votre usage personnel ; il ne peut être vendu, concédé sous licence ni partagé sur d’autres sites sans l’accord de son auteur.Le contenu vous est fourni TEL QUEL, pour votre information et votre usage personnel uniquement. Téléchargez la présentation en cliquant sur ce lien. Lors du téléchargement, si vous ne parvenez pas à télécharger une présentation, l’éditeur a peut-être supprimé le fichier de son serveur.Pendant le téléchargement, si vous ne parvenez pas à obtenir une présentation, le fichier a peut-être été supprimé par l’éditeur.

F I N

Plus de contenu associé

Transcription de la présentation
  1. Plastic Recycling Update May 30, 2012 SWMCB Board Meeting

  2. US EPA 2010 Waste Characterization Study • Plastics made up 12.4 percent of all municipal solid waste before recycling. • Over 31 million tons of plastic was generated in 2010, compared to just 390,000 tons in 1960. • The 2010 plastic recycling rate was 8.2 percent • Some plastics have better recycling recovery rates • PET bottles and jars, had a 2010 recycling rate of 29.2 percent • HDPE bottles and containers, had a 2010 recycling rate of 27.5 percent. Source: www.epa.gov/waste/nonhaz/municipal/pubs/msw2009rpt.pdf

  3. Resin Identification Codes

  4. Trends in Minnesota • Several large haulers are collecting all #1-#7 plastics. • Some cities and counties have been, or will soon add #1-#7 to their programs. • Redwood Falls - #1-#5 for several years • Hennepin County – all cities collecting #1-#5 by 2013 • Many programs still collect only #1 & #2 bottles with necks

  5. Optical Sorters • Most popular ‘new’ technology for sorting plastics • Each unit runs ~$250K • Typically sorts 1-2 categories per run

  6. Domestic and International Markets

  7. Markets for MN’s Curbside Programs • Market for PET and HDPE stable and strong • HDPE market in Minnesota include MasterMark,Bedford Technology and Recycled Plastics Inc. • 3-7 domestic markets in the US are in the beginning stages with the main markets being China and Canada • Some Minnesota markets for 3-7

  8. International • China currently imposes import tax on plastic resin • Processing capabilities going from manual processing to highly automated vertically integrated industrial parks • China aiming for 70 percent recycling rate by 2015 • China main market for 3-7 plastics

  9. Market Development • Develop Minnesota Markets for 3-7 • Currently no Minnesota processing facilities dedicated to post consumer PP or film • Domestic market for 3-7 plastics very small currently in pilot stage

  10. Wayne Gjerde Ph 651-757-2392 Cell ph 651-285-0460 wayne.gjerde@state.mn.us