
RIVERS & STREAMS
RIVERS & STREAMS. Water Reservoirs The Hydrologic Cycle Surface Water Systems Surface Water flow Sediment Transport Stream System Components Floods and flooding. Where is the Water ?. The Worlds Largest Rivers. The Hydrologic Cycle. Infiltration = Groundwater System.

RIVERS & STREAMS
E N D
Presentation Transcript
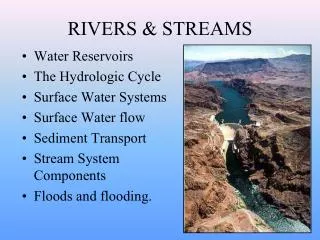
RIVERS & STREAMS • Water Reservoirs • The Hydrologic Cycle • Surface Water Systems • Surface Water flow • Sediment Transport • Stream System Components • Floods and flooding.
The Hydrologic Cycle • Infiltration = Groundwater System • Runoff = Surface Water System • Runoff = Precipitation - Evapotranspiration
U.S. Precipitation Map Notice the effect of the Rocky Mountains U.S. Runoff Map
Near-Laminar flow in the center of a river channel Turbulent flow in the headwaters of a rushing mountain stream
So Where Does The Stream Move Fastest? • Headwaters move slowest • Mouth of stream moves fastest • Laminar flow is more efficient than turbulent flow. • Deeper stream move faster than shallow streams
Stream bank 0.6D D - Velocity measurements V Price Meter Pygmy Meter
RATINGS CURVE Collect stage data continuously, transform it to discharge data To get a bit of experience with stream gaging and analysis of stream data, visit http://vcourseware4.calstatela.edu/VirtualRiver/FloodingDemo/index.html and play with it!!!
Longitudinal Stream Profile Can be divided into 3 main parts Drainage (Tributary) System Transport System Distributary System
Drainage System • Stream energy is spent eroding downward into the basement rock and... • Moving sediment • Creates “V” shaped canyon and valleys • When streams emerge from the mountain front, they often deposit some of this sediment forming alluvial fans.
Braided Streams & Rivers • High sediment load • Anastamosing channels • Constantly changing course • Floodplain completely occupied by channels • Many small islands called mid-channel bars • Usually coarse sand and gravel deposits.
Meandering Rivers • Constantly erode material - Cut bank • Constantly deposit material - Point bar • Change their channel course gradually • Create floodplains wider than the channel • Very Fertile soil • Subjected to seasonal flooding
Point Bar Deposits Point bar deposits grows laterally through time
Cut bank erosion Point bar deposits } Meander loop
Meandering stream flowing from top of screen to bottom
Maximum deposition Maximum erosion
Meander scars Oxbow Lake Oxbow cuttoff
Flood Recurrence, Skykomish R. Want some stream flow data? Try: http://water.usgs.gov/
Flood Causes examples: Snowmelt + Frozen soil examples - 2) Mohawk River, 1996 - January 18-19, 1996 thaw (temp in the 60’s) Heavy rain (4.5”) on top of snow (45”) melted enough snow to be the equivalent of >7” of rain in a few hours (in my back yard the snow went from hip deep to 0 overnight!!) Cohoes monitoring station peak flow 132,000 cfs (100 year flood? Probably not...) January 20, temperature dropped to 20o, decreasing snowmelt and freezing some water in the upper drainage basins 10 deaths, thousands flee erosion caused landslides (1 fatality) $100 million damages
Mohawk River at Cohoes, January 1996 100000 90000 80000 70000 60000 Average Daily Flow (cfs) 50000 40000 30000 20000 10000 0 12/30/95 1/6/96 1/13/96 1/20/96 1/27/96 2/3/96 date
1999 Ice Jam, Mohawk River, Rexford Bridge extremely cold weather in January --> thick ice, rapid thaw in February cause the ice to rise and break up