Download
1 / 31
310 likes | 507 Vues
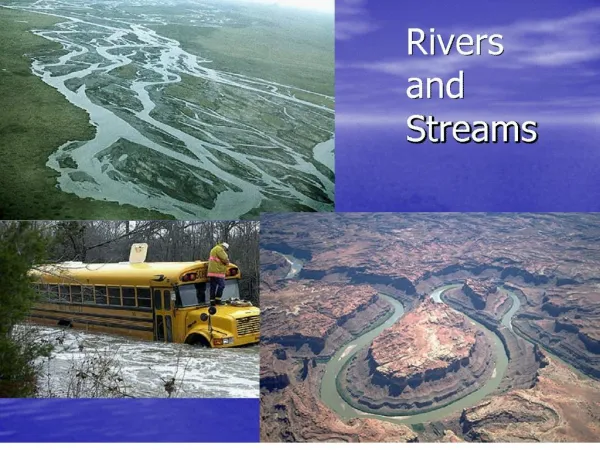
Salt and Selenium in Grand Valley Rivers and Streams. Joshua Linard U.S. Geological Survey Hydrologist jilinard@usgs.gov. Presentation Outline. Importance of salt and selenium Environmental processes controlling the movement of salt and selenium Water-quality standards for salt and selenium

E N D
Salt and Selenium in Grand Valley Rivers and Streams Joshua LinardU.S. Geological Survey Hydrologistjilinard@usgs.gov
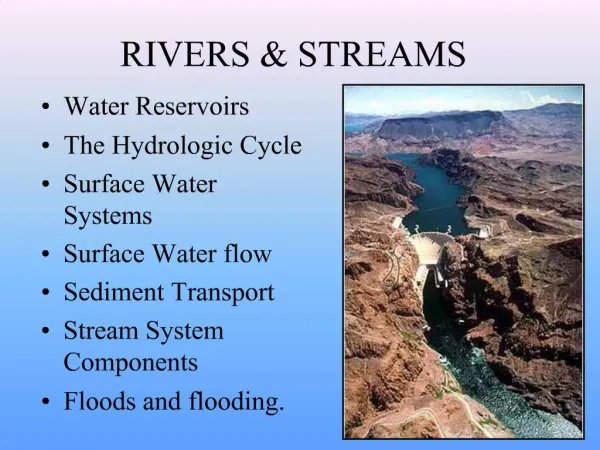
Presentation Outline • Importance of salt and selenium • Environmental processes controlling the movement of salt and selenium • Water-quality standards for salt and selenium • Salt and selenium in the Colorado River • Salt and selenium in Grand Valley tributaries • Concentration vs. load • Control initiatives • Current investigations
What are Salt and Selenium? • Salt • Total Dissolved Solids: the mass of all cations and anions in an aqueous solution • Selenium • A naturally occurring trace element • It’s essential to life, but in excess can be harmful
Why Study Salt and Selenium? • High salinity water • Clogs and corrodes household pipes and fixtures • Limits agricultural productivity • High selenium in water • Limits reproductive ability and can even be fatal to biological organisms • Colorado Pike Minnow, Razor Back Sucker, Boney Tail Chub, Hump Back Chub
Environmental Processes Tributary Stream
Sources of Water • Average annual precipitation: 8 in/yr • Canals • Irrigation: 11-70 in/yr • Residential areas • Agricultural areas
Concentration vs Load • Seasonality in salt and selenium are, generally, explored in units of … • Concentration • Units of mass/volume • Load • Units of mass/time • Salinity: tons/day • Selenium: lbs/day
Water-Quality Standards • Standards focus on concentrations • Colorado Department of Health and Environment • Salinity • Established in 1976 for the entire Colorado River Basin • Flow-weighted annual values shouldn’t exceed 723 mg/l (ppm) below Hoover Dam • Selenium • The water-quality standards are the 85th percentile for the most recent 5 year period • If 100 samples are available, 85 must be below the standard • Established in 2000 • Acute = 18.4 μg/l (ppb) • Chronic = 4.6 μg/l (ppb)
Water-Quality Standards for Salinity and the Grand Valley • Salinity standard at Hoover Dam: 723 mg/L
Water-Quality Standards for Selenium and the Grand Valley • CDPHE chronic standard for selenium: 4.6 μg/L
Why are concentrations so much higher in tributaries than in the Colorado River? Leib, K.J. 2008. Concentrations and Loads of Selenium in Selected Tributaries to the Colorado River in the Grand Valley, Western Colorado, 2004-2006. U.S. Geological Survey Scientific Investigations Report 2008-5036. • Seasonal changes in the availability of water effect the amount of salt and selenium in streams • The Colorado River has more water to dilute tributary inputs of salt and selenium • Tributary water has more interaction with the Mancos Shale in the Grand Valley
Concentration and Load vs Streamflow • Relationships to streamflow are general • At a particular point, as flow increases the load increases and concentration decreases • Vary between salt and selenium • Vary from place to place
Concentrations and Loads of Salt and Selenium Measured at the Colorado River near Colorado-Utah State Line
Concentrations and Loads of Salt and Selenium Measured at Persigo Wash at River Road
Salt and Selenium Control • Management options • Increase flow to dilute salt and selenium • Not really an option in the arid environment • Decrease load to lower concentrations • Control initiatives are aimed at minimizing loads • Minimize source loads • Decreases tributary loads • Decreases concentrations in the Colorado River
Methods to Control Salt and Selenium • Irrigation delivery system improvements • Lining and piping of canals and laterals • Irrigation system improvements • Sprinklers, drips, micro, etc. • Best Management Practices for residential areas • Line Ponds • Indirect effects from land-use change and population growth
Effects of Land-use Change on Source Loads • Quantify irrigation water use and deep percolation in representative areas where agricultural land has been converted to suburban use. • Compare irrigation water use and deep percolation at similar agricultural and suburban sites in the Grand Valley. • Quantify deep percolation from pond seepage for a selected number of ponds. From Mayo, J.W. 2008. Estimating the effects of conversion of agricultural land to urban land on deep percolation of irrigation water in the Grand Valley, Western Colorado. U.S. Geological Survey Scientific Investigations Report 2008-5086.
Explanation Homes & Fields Weather Stations Ponds Grand Valley Sites • 14 Homes • 4 Gated-Pipe Fields • 3 Ponds • 2 CSU Weather Stations • Monitored for 2 irrigation seasons (2005 & 2006)
Typical Residential Sites ¼-Acre Subdivision - bluegrass 5-Acre Estate - bluegrass 5-Acre Estate - Native Plants 5-Acre Estate – Orchard Grass
Typical Gated Pipe Sites Quail Run – orchard grass CSU – orchard grass
Typical PondSites Paradise Hills Pond Chipeta Pines Pond
Irrigation Water Use and Deep Percolation(average acre-feet of water per acre for irrigation season) 1 Acreage for ¼ acre subdivisions in study was 40 percent irrigated on average 2 Acreage for 5 acre estates in study was 32 percent irrigated on average 3 Acreage for gated-pipe and alfalfa sites was assumed to be 90 percent irrigated 4 Acreage for irrigation holding ponds was assumed to be 100 percent covered with water 5 Numbers in parentheses are the range of values
Salt Loading(tons per acre per year) • NRCS salt-loading factor for the Grand Valley is 4.1 tons per acre-foot of water applied, with an estimated 50 percent of the load reaching the Colorado River.
Can we see the effects of their implementation in the water-quality of the streams? From 1986 to 2003 the salinity load measured at the Colorado-Utah Stateline has decreased by over 300,000 tons. Butler, D.L., 1996, Trend analysis of selected water-quality data associated with salinity-control projects in the Grand Valley, in the Lower Gunnison River Basin, and at Meeker Dome, Western Colorado: U.S. Geological Survey Water-Resources Investigations Report 95-4274, 38 p. Bauch, N.J., and Spahr, N.E., 1998, Salinity Trends in Surface Waters of the Upper Colorado River Basin, Colorado: Journal of Environmental Quality, v. 27, no. 3, p. 640-655. Leib, K.J. and Bauch, N.J., 2007, Salinity trends in the Upper Colorado River Basin upstream from the Grand Valley Salinity Control Unit, Colorado, 1986-2003, U.S. Geological Survey Scientific Investigations Report 2007-5288.
Summary • Underlying geology is the source of salt and selenium • Ground water transports salt and selenium to the rivers and streams in the Grand Valley • Water-quality at the Colorado-Utah State Line meets standards • Concentrations and Loads vary • Seasonally • Between salt and selenium • Place to place
Summary • Minimizing source loads in tributaries of the Grand Valley, minimizes concentrations in the Colorado River • Controlling sources of salt and selenium • Irrigation practices • Best management practices • Land-use • Conversion from previously irrigated land to residential reduces source loading • Long-term trends indicate control initiatives are working
Websites:http://co.water.usgs.gov/index.htmlhttp://waterdata.usgs.gov/co/nwis/rt/http://rmgsc.cr.usgs.gov/cwqdr/Piceance/index.shtmlhttp://wdr.water.usgs.gov/nwisgmap/Websites:http://co.water.usgs.gov/index.htmlhttp://waterdata.usgs.gov/co/nwis/rt/http://rmgsc.cr.usgs.gov/cwqdr/Piceance/index.shtmlhttp://wdr.water.usgs.gov/nwisgmap/