Download
1 / 106
1.2k likes | 1.7k Vues
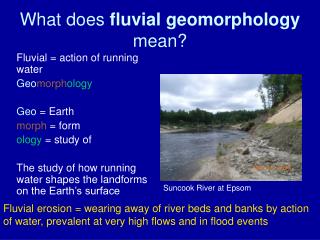
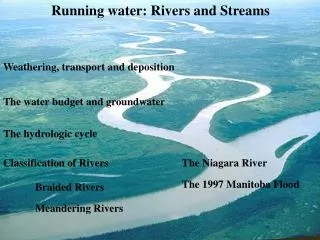
Running water: Rivers and Streams. Weathering, transport and deposition. The water budget and groundwater. The hydrologic cycle. Classification of Rivers. The Niagara River. The 1997 Manitoba Flood. Braided Rivers. Meandering Rivers. The Water Budget and Groundwater.

E N D
Running water: Rivers and Streams Weathering, transport and deposition The water budget and groundwater The hydrologic cycle Classification of Rivers The Niagara River The 1997 Manitoba Flood Braided Rivers Meandering Rivers
The Water Budget and Groundwater Total Water on Earth 1,360,000,000 km3 Oceans and Seas 1,331,746,800 km3 (97.9%) Glaciers and Ice Sheets 24,000,000 km3 (1.8%) Groundwater 4,000,000 km3 (0.3%) Lakes and Reservoirs 155,000 km3 Soil Moisture 83,000 km3 Vapor in the atmosphere 14,000 km3 Rivers 1,200 km3
Groundwater resides within the Earth. The only water source for many areas (e.g., Walkerton) Water filling void spaces in rocks and sediment. Water table: the surface below which groundwater fills void spaces. Zone of aeration: above the water table; voids filled with air. Zone of saturation: below the water table; voids filled with water.
Effluent Rivers: water table rises to river bed (groundwater adds to the river)
Effluent Rivers: water table rises to river bed (groundwater adds to the river) Influent Rivers: water table is below the river bed (river adds to groundwater).
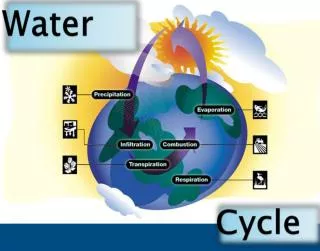
The Hydrologic Cycle From Lutgens and Tarbuck, figure 6-9 The constant exchange of water between all of the water reservoirs is termed the Hydrologic cycle. The cycle is balanced over time.
The exchange between land and oceans is largely via rivers: Of the 380,000 km3 of water in the cycle: Land Oceans Precipitated: 25.3% 74.7% Evaporated: 15.8% 84.2% Net: +9.5% -9.5% 0.095 x 380,000 km3 = 36,100 km3of excess water to the land. Total discharge into the oceans by rivers is 36,000 km3 99.7% of excess water to the land is returned to the oceans by rivers.
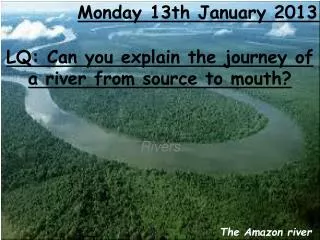
Rivers Rivers deliver water and vast amounts of clastic sediment and material in solution to the world’s oceans. A river’s discharge is the volume of water moving through a river over a given period of time. A river’s sediment discharge is the volume of sediment moving with the water of a river over a given period of time. The ten largest rivers on Earth deliver 36% of all water that flows into the oceans. The Amazon River delivers 15% of the world total. 6,300 km3/year or 200,000 m3/second
River discharge depends on: Orinoco 30% of Mississippi basin area; 190% of water discharge. Tropical versus mid-latitude setting; more rainfall. Climate Relief Drainage basin area Geology
The Ganges-Brahmaputra drains the Himalayan Mountains (high relief, high rates of erosion) Ganges-Brahmaputra: 24% of Amazon basin area; 15% of water discharge; 185% of sediment discharge.
20 billion tonnes of the products of weathering are carried annually by rivers to the oceans: Approx. 16 billion tonnes of clastic sediment Approx. 4 billion tonnes of dissolved material Clastic sediment is transported in rivers as: Bed Load: large particles that move in contact with the bed. Suspension Load: fine sand, silt and clay that “floats” along with the water. Over 90% of the total clastic sediment discharge into the oceans is as suspended load.
20 billionTonnes/yr = 8 km3/yr = 800 km3/100yrs = 8,000 km3/1000yrs = 8,000,000 km3/1,000,000yrs etc., etc., etc. So why aren’t the continents flattened out by now? Plate Tectonics: volcanism, igneous intrusion, thrusting and folding all build the continents.
Flow in Rivers Arroyos are steep-sided valleys produced by some ephemeral stream. Discharge varies seasonally, daily and hourly. Some rivers always have discharge. Some rivers are dry over much of the year (ephemeral rivers).
Hydrograph: a graph showing the variation in a river’s discharge with time. Annual Hydrograph is a hydrograph showing variation in dischage over the course of a year.
Winter: accumulation of snow/ice cause lowest discharge). Spring melt: maximum annual discharge. Summer/Fall: rainstorms cause short duration discharge peaks.
Single storm hydrographs show the discharge of a river for a single rainfall event. In a natural setting rainfall precedes the peak river discharge by Lag Time: time required for rain to soak into the ground until it is saturated and then flows over the land surface into rivers. Lag time can be hours to days, depending on area, relief and the nature of the drainage basin. A natural surface behaves like a sponge, soaking rainwater into the ground; removing it from the surface.
Cities are vast, impermeable surfaces (water doesn’t soak into the ground) with human facilities to rapidly direct runoff to rivers (streets, storm drains, storm sewers). Urbanization reduces lag time and increase the peak discharge.
Why does urbanization increase the risk of flooding? Paving streets and parking lots, storm drains. Greater runoff = higher storm peak.
Flood Frequency Curves Annual maximum discharge versus time between each occurrence of that discharge for a given river. Used to determine the risk of flooding by a given river.
Data plot as a straight line which defines the Flood Frequency Curve. e.g. 20,000 ft3/s every 1.2 years 50,000 ft3/s every 5 years
100 year flood:discharge with a recurrence rate of 100 years. Curve shows the the probability of a given discharge occurring in a particular year. 20,000 ft3/s, 80% chance in a year 8 of 10 years 20,000 ft3/s will be exceeded. 100,000 ft3/s, 1% chance in a given year. This is the 100 year flood for the Skykomish River.
Classification of Rivers Braided Rivers Multiple, interconnecting channels. Relatively steep slopes. Coarse sediment in transport, mostly bedload. Discharge highly variable over time (not uniform)
Meandering Rivers Single, sinusoidal (meandering) channel. Relatively gentle slopes. Sediment is fine-grained, mostly by suspension load. Discharge is more uniform with time.
Braided Rivers Channel system occupies the entire floodplain. During high discharge the entire floodplain is covered forming a single channel. Longitudinal bars migrate downstream during floods.
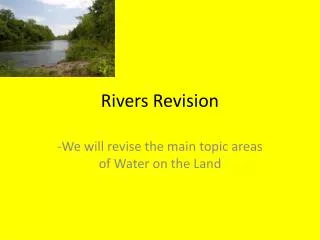
Classification of Rivers Braided Rivers and Meandering Rivers
During floods, longitudinal bars migrate down stream. http://www.usra.edu/esse/ford/ESS205/fluvial/Rakaia1.jpg
Migration of a longitudinal bar. Longitudinal bar
Migration of a longitudinal bar. Longitudinal bar
Migration of a longitudinal bar. Longitudinal bar
Migration of a longitudinal bar. Longitudinal bar
Migration of a longitudinal bar. Longitudinal bar
Migration of a longitudinal bar. Longitudinal bar
Migration of a longitudinal bar. Longitudinal bar
The deposits of ancient braided rivers are characterized by horizontal beds of gravel with cross-strata dipping in the direction of longitudinal bar migration.
Meandering Rivers The channel occupies a small part of the floodplain. Morphological features include: Levees Point bars Chute channels Oxbow lakes Meander scars
Straight channels evolve into meandering channels. Thalweg: deepest part of a channel Thalweg defines a line that meanders through a straight channel. Erosion where the thalweg is close and deposition where the thalweg is farthest from channel margin.
The boundary shear stress (to) at the floor of the channel determines whether or not erosion will take place. Where r is the density of water; g is the acceleration due to gravity; D is the water depth; S is the slope of the channel. Where the water is deepest (i.e. along the thalweg)to is greatest and erosion occurs. As the thalweg alternates from side to side along the channel the sites of erosion and deposition also alternate along the channel.