Download
1 / 55
550 likes | 683 Vues
Suffer the little children: on anti child poverty policies since 1997. Robert Walker University of Oxford & Institute for Fiscal Studies. UK government agenda. Policy ambitions Origins of anti-child poverty agenda Motivation Analysis Strategy Outcomes Constraints.

E N D
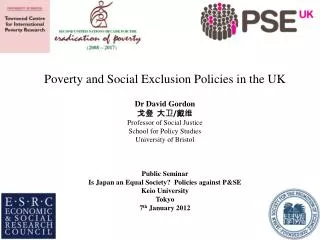
Suffer the little children: on anti child poverty policies since 1997 Robert Walker University of Oxford & Institute for Fiscal Studies
UK government agenda • Policy ambitions • Origins of anti-child poverty agenda • Motivation • Analysis • Strategy • Outcomes • Constraints
Policy ambitions: Part of socio-economic strategy • Maintaining a strong economy. Economic growth and social justice go hand in hand. • Ensuring through flexible labour marketsthat work is available for all who can work. • Developing first-class servicesthat meet the needs of all our population in a way that is accessible and accountable. 2003: United Kingdom National Action Plan on Social Inclusion 2003–05 London: Department for Work and Pensions
The origins Our historic aim will be for ours to be the first generation to end child poverty, and it will take a generation. It is a 20-year mission but I believe it can be done. Tony Blair, The Beveridge Lecture, Toynbee Hall, 18th March 1999
Origins: future-orientated rationale • We have made children our top priority because, as the Chancellor memorably said in his Budget, “they are 20% of the population but they are 100% of the future”. • We need to break the cycle of disadvantage so that children born into poverty are not condemned to social exclusion and deprivation.
The motivation • Upward trend in child poverty • International comparison • The scarring effects • Child development • Intergenerational transmission of disadvantage
Child poverty:1979-1995/660 per cent equivalent household income
The motivation • Upward trend in child poverty • International comparison • The scarring effects • Child development • Intergenerational transmission of disadvantage
Euro-mean Child poverty rates 199560% of the national equivalised median income.
The motivation • Upward trend in child poverty • International comparison • The scarring effects • Child development • Intergenerational transmission of disadvantage
The economy Individuals Families Communities Scarring Child poverty
The economy Individuals Families Communities Scarring Child poverty Individuals Poor children are more likely to: • Have low educational attainment13 • Be in poor health3 • Play truant2 • Have low income as an adult2 • Become a teenage mother23 • Live in social housing as an adult1 1 - 1999: Tackling poverty and extending Opportunity, London: HM Treasury 2 – 1999:Tony Blair, The Beveridge Lecture, Toynbee Hall, 18th March 1999 3 - 2001: Tackling child poverty: giving every child the best possible start in life, London HM Treasury (A Pre-Budget Report Document)
The economy Individuals Families Communities Scarring Child poverty Families Poverty generates: • Persistence between generations • In the risk of poverty • In low educational attainment • Parental unemployment begets unemployment 1999: Tackling poverty and extending Opportunity, London: HM Treasury
The economy Individuals Families Communities Scarring Child poverty Communities Poor children are more likely to: • Engage in anti-social behaviour1 • Commit crime13 • Have low expectations23 • Live in deprived neighbourhoods3 1 - 1999: Tackling poverty and extending Opportunity, London: HM Treasury 2 - 2001: Opportunity for All, Third Annual Report 3 - 2001: Tackling child poverty: giving every child the best possible start in life, London HM Treasury (A Pre-Budget Report Document)
The economy Individuals Families Communities Scarring Child poverty The economy Poor children are more likely to: • Have poor literacy and numeracy13 • Leave school at 163 • Experience unemployment as an adult3 • Be in poor health as an adult • Have low income as an adult2 • Not be socially mobile23 1 - 1999: Tackling poverty and extending Opportunity, London: HM Treasury 2 - 1999:Tony Blair, The Beveridge Lecture, Toynbee Hall, 18th March 1999 3 - 2001: Tackling child poverty: giving every child the best possible start in life, London HM Treasury (A Pre-Budget Report Document)
At least 1/3 of correlation between family income and educational attainment due to income alone Family/ household income Child/adult outcomes Analysis(‘Tackling Child Poverty’ 2001) 2001: Tackling child poverty: giving every child the best possible start in life, London HM Treasury (A Pre-Budget Report Document) 2001: Plewis, Smith, Wright and Cullis Linking Child Poverty and Child Outcomes: Exploring Data and Research Strategies. London: Department for Work and Pensions Working Paper No 1, 2001: Blanden, Gregg and Machin Family Income and Children’s Educational Attainment: Evidence from the NCDS and BCS. Working paper presented at IPPR child poverty conference November.
Family/ household income Child/adult outcomes Neighbourhood characteristics (including availability and quality of services, education and health) Analysis
Family/ household income Child/adult outcomes Neighbourhood characteristics (including availability and quality of services, education and health) Analysis Up to 1/2 of effects of childhood disadvantage on adult economic and social outcomes attributed to education 1999: Gregg and Machin Child Development and Family Income Joseph Rowntree Foundation.
Transmission/processes within the family Family/ household income Child/adult outcomes Neighbourhood characteristics (including availability and quality of services, education and health) Analysis • Poor family relationships and parenting are key risk factors in: • drug abuse, • youth crime, • teenage • pregnancy, • mental health problems • homelessness, • educational attainment. • 2000: Report of Policy Action Team 12: Young People, London: Social ExclusionUnit
Transmission/processes within the family Family/ household income Child/adult outcomes Neighbourhood characteristics (including availability and quality of services, education and health) Analysis
Transmission/processes within the family Family/ household income Child/adult outcomes Neighbourhood characteristics (including availability and quality of services, education and health) Analysis
Transmission/processes within the family Family/ household income Child/adult outcomes Neighbourhood characteristics (including availability and quality of services, education and health) Analysis
Transmission/processes within the family Family/ household income Child/adult outcomes Neighbourhood characteristics (including availability and quality of services, education and health) Analysis
Transmission/processes within the family Family/ household income Child/adult outcomes Neighbourhood characteristics (including availability and quality of services, education and health) Analysis
Transmission/processes within the family Family/ household income Child/adult outcomes Neighbourhood characteristics (including availability and quality of services, education and health) Analysis
Transmission/processes within the family Family/ household income Child/adult outcomes Neighbourhood characteristics (including availability and quality of services, education and health) Analysis
Transmission/processes within the family Family/ household income Neighbourhood characteristics (including availability and quality of services, education and health) Analysis
Transmission/processes within the family Family/ household income Neighbourhood characteristics (including availability and quality of services, education and health) Analysis
Transmission/processes within the family Family/ household income Neighbourhood characteristics (including availability and quality of services, education and health) Analysis
Transmission/processes within the family Family/ household income Neighbourhood characteristics (including availability and quality of services, education and health) Analysis
Transmission/processes within the family Family/ household income Neighbourhood characteristics (including availability and quality of services, education and health) Analysis
Transmission/processes within the family Family/ household income Neighbourhood characteristics (including availability and quality of services, education and health) Strategy (2004 version)
Transmission/processes within the family Family/ household income Neighbourhood characteristics (including availability and quality of services, education and health) Strategy (2004 version) • Ensuring • decent family incomes (helping to ensure[2001]) with: • Work for those who can • Support for those who cannot • (Security [1998]) Supporting parents in their parenting role Delivering high quality services to break cycle of deprivation (for all neighbourhoods and targeted interventions for those with additional needs [2001]) Harnessing power and expertise of voluntary and community sectors (providing support for innovation and good practice [2001]) 2004: Child Poverty Review, London: HM Treasury 2001: Tackling child poverty: giving every child the best possible start in life, London HM Treasury (A Pre-Budget Report Document) 1998: New Ambitions for Our Country: a new contract for welfare, London: Department of Social Security.
Family/ household income Strategy (2004 version) Targets • Halve the number of children in relative low-income households between 1998-9 and 2010/1 • Reduce % of children living in workless households by 5.0 % between 2005 and 2008 (spring) • Increase % of Parents with Care on benefits who receive maintenance to 65% per cent by March 2008 • Increase the overall employment rate • Reduce gap between the employment rates of disadvantaged groups and the overall rate • Ensuring • decent family incomes (helping to ensure[2001]) with: • Work for those who can • Support for those who cannot • (Security [1998])
1 Welfare to work New Deals (Activation) Young People (18 to 24) M 25 plus M (Mandatory) 50 plus V (Voluntary) Disabled People V Lone Parents V Partners V Self-employed Musicians Employment Zones Pooling of benefits with other funds for individualised work packages Work focussed interviews For all of working age Family/ household income Strategy (2004 version) • Ensuring • decent family incomes (helping to ensure[2001]) with: • Work for those who can • Support for those who cannot • (Security [1998])
2 Make work pay Minimum wage (43% median wages) Tax credits Working tax credit (refundable) A basic adult element Extra elements: single parents and couples childcare (up to 70%of cost to a maximum of £175.00 per week for one child and £300.00 for two or more children) work 30 hours or more a week working and have a disability working and have a severe disability Child tax credit (refundable) Family element Element for each child Family/ household income Strategy (2004 version) • Ensuring • decent family incomes (helping to ensure[2001]) with: • Work for those who can • Support for those who cannot • (Security [1998])
2 Make work pay Minimum wage (43% median wages) Tax credits Working tax credit (refundable) A basic adult element Extra elements: single parents and couples childcare (up to 70%of cost to a maximum of £175.00 per week for one child and £300.00 for two or more children) work 30 hours or more a week working and have a disability working and have a severe disability Child tax credit (refundable) Family element Element for each child Reduce main income tax rate Family/ household income Strategy (2004 version) • Ensuring • decent family incomes (helping to ensure[2001]) with: • Work for those who can • Support for those who cannot • (Security [1998])
Support Child Benefit 25% real term increase for first child Child Tax Credit 70% real increase in additional payment for disabled child Reform of Child Support (child maintenance) Family/ household income Strategy (2004 version) • Ensuring • decent family incomes (helping to ensure[2001]) with: • Work for those who can • Support for those who cannot • (Security [1998])
£billion (2002prices) £/child/week (2002 prices) 40 40 30 30 Total support (LHS) Support per 20 20 child (RHS) 10 10 0 0 75 77 79 81 83 85 87 89 91 93 95 97 99 01 03 Financial year starting UK tax and benefit support for children, 1975-2003 2005: Can Child Poverty be Abolished? Promises and Policies in the UK, H. Sutherland: ASPC Sydney 20th July 2005,
£billion (2002prices) £/child/week (2002 prices) 40 40 30 30 Total support (LHS) Support per 20 20 child (RHS) 10 10 0 0 75 77 79 81 83 85 87 89 91 93 95 97 99 01 03 Financial year starting UK tax and benefit support for children, 1975-2003 2005: Can Child Poverty be Abolished? Promises and Policies in the UK, H. Sutherland: ASPC Sydney 20th July 2005,
Neighbourhood characteristics (including availability and quality of services, education and health) Strategy (2004 version) Examples • Early years • Funding allocated to support new childcare places for 2 million children between 1997 and 2006 • SureStart: Over 500 local programmes to provide a wide range of family services in disadvantaged communities. • School education • Education Maintenance Allowances (EMAs) provide up to £1,500 per annum young people to remain in schools and colleges • Health • National Service Framework for Children Young People and Maternity Services • Housing • Bring all social housing into a decent condition by 2010 Delivering high quality services to break cycle of deprivation (for all neighbourhoods and targeted interventions for those with additional needs [2001]) Harnessing power and expertise of voluntary and community sectors (providing support for innovation and good practice [2001])
Transmission/processes within the family Strategy (2004 version) Support • Children’s Fund • 149 Partnerships at local authority level: focused on supporting • 5-13 year old children at home, in school, and in the wider community • parenting, and parents with other issues: domestic violence, counselling, family support and health • Parenting Fund • £25million to supports services delivered by voluntary and community sector organisations that offer early help to parents experiencing difficulties. • Home-Start (NGO) • 333+ schemes to match families facing difficulties with trained volunteers who provide friendship, practical and emotional support. Supporting parents in their parenting role
Impact: Child poverty:1979-2004/560 per cent equivalent household income
Euro-mean Child poverty rates 1995-200460% of the national equivalised median income. Source: Eurostat
% change in child poverty rates 1995-200460% of the national equivalised median income.
Why not more successful? • Ambitious • Impact still to become evident ‘it will take a generation’ • Measurement error • Chasing moving target (median incomes increasing)
Why not more successful? • Ambitious • Impact still to become evident ‘it will take a generation’ • Measurement error • Chasing moving target (median incomes increasing)
Why not more successful? • Ambitious • Impact still to become evident ‘it will take a generation’ • Measurement error • Chasing moving target (median incomes increasing) • Under-reporting of income • Under-reporting of tax credits in surveys • 4.7 million instead of 5.5 million families
Why not more successful? • Ambitious • Impact still to become evident ‘it will take a generation’ • Measurement error • Chasing moving target (median incomes increasing)
10% fall 15% fall Moving income target 2005: H. Sutherland: Can Child Poverty be Abolished? Promises and Policies in the UK, ASPC Sydney 20th July 2005,