
Association of PWCFT with Physical Functionality in Low Risk Elderly
Explore the correlation between Physical Working Capacity at Fatigue Threshold (PWCFT) and measures of physical health in older adults. The study indicates a significant relationship between PWCFT and functional capacity for elderly in low-risk categories.

Association of PWCFT with Physical Functionality in Low Risk Elderly
E N D
Presentation Transcript
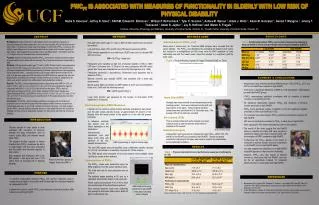
PWCFT IS ASSOCIATED WITH MEASURES OF FUNCTIONALITY IN ELDERLY WITH LOW RISK OF PHYSICAL DISABILITY Nadia S. Emerson1, Jeffrey R. Stout 1, FACSM, Edward H. Robinson 1, William P. McCormack 1, Tyler C. Scanlon 1, Ashlee M. Warren 2, Adam J. Wells 1, Adam M. Gonzalez 1, Gerald T. Mangine1, Jeremy T. Townsend 1, Adam R. Jajtner1, Jay R. Hoffman1 and Maren S. Fragala1 1 Institute of Exercise Physiology and Wellness, University of Central Florida, Orlando, FL, 2Health Center, University of Central Florida, Orlando, FL RESULTS CONT. ABSTRACT METHODS CONT. METHODS Background: Physical function in older adults is often evaluated with measures of muscular strength and body composition, such as muscle quality (MQ) and skeletal muscle index (SMI). The physical working capacity at fatigue threshold test (PWCFT) measures the ability to resist fatigue and has been associated with the health and functional capacity of older adults. Data suggests that individuals with a low SMI (women < 5.45 kg/m2 and men < 7.26 kgm2) have an increased risk of physical disability. Purpose: Examine relationships between PWCFT and common measures used to assess physical health in older adults with low and high risk of physical disability as categorized by SMI.Methods:Fifty-eight older adults (age: 71.1±6.2 y; BMI: 28.0±5.4 kg/m2) were categorized into low risk (n=36) or high risk (n=22) groups. Lean soft tissue mass (LST) and fat mass (FM) were measured by DEXA and participants performed a discontinuous cycle ergometry test to determine PWCFT. Maximal isometric grip strength (GRIP) and sit-to-stand (STS) reps in 30 sec were measured. MQ was defined as GRIP relative to appendicular lean soft tissue (ALST) and SMI as ALST/height2. Simple and Partial correlations,adjusting for fat mass, were used to examine the relationships among dependent variables. Results: The PWCFT showed significantly positive relationships with GRIP (r= 0.62, p< 0.001), STS (r= 0.50, p< 0.01), and LST (r= 0.61, p< 0.001) and a significantly negative relationship with FM (r= -0.33, p< 0.05) only in the low risk group. PWCFT was not significantly correlated to MQ (p> 0.05). When adjusting for FM, similar results were observed between PWCFT and GRIP (r= 0.64, p< 0.001), STS (r= .41, p< 0.01), and LST (r= 0.61, p< 0.001) in the low risk group. No significant (p< 0.05) relationships were found for the high risk group.Conclusion: The PWCFT demonstrated a significant correlation with all variables of physical function in the low risk group with the exception of MQ; however, no significant relationships were seen in any of the variables for the high risk group. Our data suggest that the PWCFT may be related to physical function in older adults with low risk of physical disability, but may not be an appropriate measure for older adults with high risk of physical disability. Determination of PWCFT cont. • Table 2. Relationship between PWCFT and common measures for assessing physical health in elderly at low and high risk of physical disability (RiskPD) • Fifty-eight older adults (age: 71.1±6.2 y; BMI: 28.0±5.4 kg/m2) were included in this analysis. • Lean soft tissue mass (LST) and fat mass (FM) were measured by DEXA. • DEXA derived appendicular lean soft tissue (ALST) was used to calculate SMI with the formula: • SMI = ALST(kg) ∙ height (m)2 • Participants were classified as high risk of physical disability (n=36) by SMI< 5.45 kg•m-2 for women and < 7.26 kg•m-2 for men; participants with SMI values greater than these were classified as low risk (n=22) (Baumgartner et al. 1998). • Participants performed a discontinuous, incremental cycle ergometry test to determine PWCFT. • Maximal isometric grip strength (GRIP) was assessed with a hand grip dynamometer. • Muscle quality (MQ) was defined as GRIP relative to ALST as recommended by Porter et al. (1998) with the following formula: • MQ = [GRIP (kg)/ALST(kg)-1] • Lower body function was assessed by the number of sit-to-stand (STS) repetitions in 30 seconds. During each 2 minute bout, six 10-second EMG samples were recorded from the vastuslateralis. The PWCFT was determined by averaging the highest power output that resulted in a nonsignificant (p>0.05) slope value for EMG amplitude vs. time relationship and with the lowest power output the resulted in a significant (p≤0.05) slope value. • Figure 1. Physical Working Capacity at Fatigue Threshold (EMG vs. Time) *p <0.05, **p ≤ 0.01 SUMMARY & CONCLUSIONS • Independent t tests revealed significant differences (p< 0.05) in PWCFT, STS, and LST for low RiskPD as compared to high RiskPD. • There were no significant differences in GRIP (p=.318) and MQ (p= .096) between low and high RiskPD groups. • PWCFT demonstrated significant correlations with all variables of physical function in low RiskPD (p<0.05). Hand Grip (GRIP) • Handgrip was measured with a hand dynamometer in the standing position. Arms were adducted to sides with a 90 degree bend at the elbow. Three maximal isometric contractions were performed for 3 to 5 seconds each. The average of the three trials was recorded • No significant relationships between PWCFTand measures of physical function were seen in high RiskPD. • PWCFT had a significant positive correlation to LST and significant negative correlation to FM in low RiskPD (p< 0.05). • No correlation was seen between PWCFT and body composition measures for high RiskPD. • MQ was not significantly correlated to PWCFT in either low or high RiskPD. • After adjusting for FM, results remained the same for all variables. Electromyography (EMG) Measures • A bipolar (4.6 cm center-to-center) surface electrode arrangement was placed over the right vastuslateralis muscle, at approximately 60 percent of the distance from the lateral portion of the patella on a line with the greater trochanter. Sit-to-Stand (STS) INTRODUCTION • A reference electrode was placed over the lateral epicondyle of the distal femur. • Inter-electrode impedance was kept below 5,000 ohms with abrasion of the skin beneath the electrodes. • From a seated positionwith arms crossed over chest, subjects stood up and sat down as many times as possible for 30 seconds. • Physical function in older adults is often evaluated with measures of muscular strength and body composition, such as muscle quality (MQ) and skeletal muscle index (SMI). • The physical working capacity at fatigue threshold test (PWCFT) measures the ability to resist fatigue and has been associated with the health and functional capacity of older adults. • Data suggests that individuals with a low SMI (women < 5.45 kg/m2 and men < 7.26 kg/m2) have an increased risk of physical disability. • The results of this study suggest that low RiskPD rating as classified according SMI value resulted in significantly higher performance measurements, with the exception of GRIP, compared to high RiskPD. • Furthermore, the PWCFT appears to be related to measures of physical function and body composition in low RiskPD, but not high RiskPD elderly. • Our data suggest that classifying low or high RiskPD using SMI appears to reflect muscle functionality. • However, PWCFT was only related to physical function in older adults with low RiskPD, and may not be an appropriate measure for assessing physical function in older adults with high RiskPD. 30 second Sit to Stand Statistical Analysis • Independent t tests were used to compare the mean PWCFT, GRIP, STS, LST, and MQ of low RiskPD as compared to high RiskPD. Simple and partial correlations,adjusting for fat mass, were used to examine the relationships among dependent variables. EMG signal during a single 2-minute stage RESULTS • The raw EMG signals were pre-amplified using a differential amplifier, sampled at 1,000 Hz, and stored on a laboratory computer for off-line analysis. • The EMG signals were expressed as root mean square (rms) amplitude values (µVrms) by custom written software. Table 1.Physical characteristics and performance measures of participants (n = 58) PWCFT • Physical Working Capacity at Fatigue Threshold (PWCFT) Determination of PWCFT • The PWCFT values were determined using the EMG amplitude from the vastuslateralis muscle. • The initial work rate for each participant was set at 30 W. • The subjects began pedaling at 50 rpm on a calibrated, electronically braked cycle ergometer. • Power output was increased 10 to 20 W for each two-minute stage of the discontinuous protocol. • Rest intervals between bouts were sufficiently long enough to allow heart rate to return within 20 bpm of resting heart rate. PURPOSE REFERENCES To examine relationships between PWCFT and common measures used to assess physical health in older adults with low and high risk of physical disability as categorized by SMI Evaluate the extent to which PWCFT and measures of physical function differ between low and high RiskPD Baumgartner RN, Koehler KM, Gallagher D, Romero L, Heymsfield SB, Ross RR, Garry PJ, Linderman RD (1998) Epidemiology of sarcopenia among the elderly in New Mexico. Am J Epidemiol147:755-763.. Porter MM, Myint A, Kramer JF, Vandervoort AA (1995) Concentric and eccentric knee extension strength in older and younger men and women. Can J ApplPhysiol 20:429-439.. EMG analysis showing significant positive EMG v. time slope indicating onset of fatigue Values reported as mean ± SD; *p <0.05, **p ≤ 0.01 between low and high SMI


