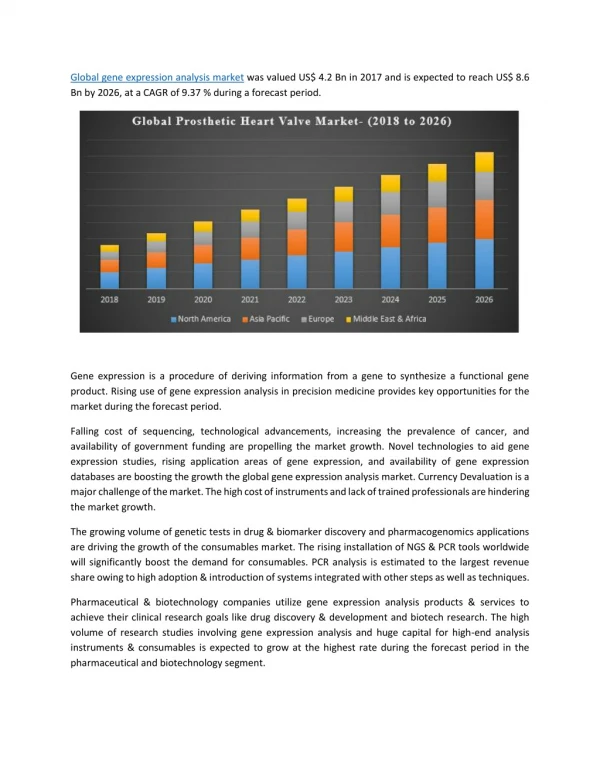
Understanding Microarray Data Analysis: Techniques and Tools for Global Gene Expression Analysis
Analyzing global gene expression microarray data provides insights into gene transcription levels in tissues, aiding in disease classification, treatment predictions, and regulatory network inference. Various computational challenges, including image analysis, data normalization, and gene clustering, are addressed. Tools like SAM and Cluster aid in identifying differential expression, while Pearson correlation coefficients help in clustering similar gene expression patterns. Key techniques include log transformation for data interpretation and guilt by association for identifying co-regulated genes. The paper by DeRisi explores how isozymes can be studied for promoter functionality.

Understanding Microarray Data Analysis: Techniques and Tools for Global Gene Expression Analysis
E N D
Presentation Transcript
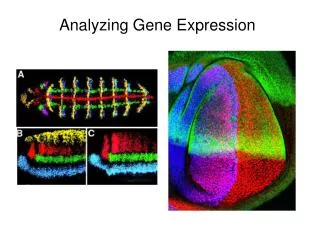
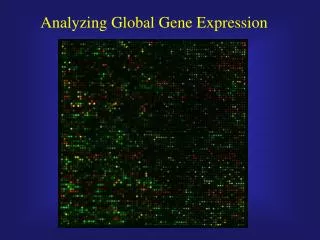
Microarray Data • A “snapshot” of the amount of a particular gene being transcribed in a tissue • Measured for tens of thousands of genes • Use of multiple tissues on a single array allow for direct comparisons between tissues
Objectives of Microarray Studies • Which genes are affected when exposed to a “treatment”? • Hit it with a stick and see what happens • Given a “profile” of levels of expression for many genes, can the unknown “treatment” be predicted? • Tumor or disease classification • Time course experiments allow the study of coregulation of genes, and for the reconstruction of regulatory networks
Many computational and statistical problems • Image analysis (spot identification, background, etc.) • Data management and pipelining • “Normalization” of data • Clustering coregulated genes • Classifying tissue types • Regulatory network inference • Promoter identification (when combined with genomic sequence data)
Normalization Cy5 signal (log2) Cy3 signal (log2)
then apply slope and intercept to the original dataset repeat until r2 changes by < 0.001 Normalization by iterative linear regression • fit a line (y=mx+b) to the data set • set aside outliers (residuals > 2 x s.e.) D Finkelstein et al. http://www.camda.duke.edu/CAMDA00/abstracts.asp
Normalization (Linear) Cy5 signal (log2) Cy3 signal (log2)
Normalization (Linear) Cy5 signal (log2) Cy3 signal (log2)
Looking for significance in microarray data • Tools: • SAM • Cluster • TreeView
Identifying differential expression SAM Significance Analysis of Microarrays Tusher et al., PNAS 2001 http://www-stat.stanford.edu/~tibs/SAM/index.html
More freeware tools for microarray analysis • indexed at Y.F. Leung’s Functional Genomics site: http://ihome.cuhk.edu.hk/~b400559/ • MeV (TIGR) www.tigr.org • MAExplorer (NCI) www.lecb.ncifcrf.gov/MAExplorer/ • Expression Profiler (EBI) • http://ep.ebi.ac.uk/ • many of these tools require a Java Virtual Machine
Data Transformation (MM 4.1) • Compute activation or repression by ratio of red/green control • However, discrepancies in interpreting repression vs. activation numbers • Solution: Log transformation of data • Log10(4) = 0.6 while log10(.25) = -0.6
Pearson correlation coefficient • Provides a measure of similarity between expression patterns • Calculate mean and standard deviation for the rows in question (Table 4.2) • Subtract the appropriate mean from each value in a row and divide by the standard deviation to generate a normalized row of data • Multiply corresponding values from each row and keep a running total • Divide the total by number of elements in the row to get the correlation coefficient
Merit of this coefficient • If identical patterns, value should be 1.0 • Reciprocal patterns, value should –1.0 • USE LOG TRANSFORMED DATA for computation of Pearson coefficient • Used in Clustering
Clustering genes • Combine rows pairwise based on Pearson coefficients until all rows accounted for • Eisen et al. 1998. Cluster analysis and display of genome-wide expression patterns. PNAS 95:14863-14868
Guilt by association • Genes exhibiting similar expression patterns are thought to be involved in common physiological processes • Can be used to find potential regulatory sequences
Controlling isozyme expression • Isozymes are distinct enzymes that catalyze the same reaction • Isozymes often have kinetic properties, cofactor requirements and/or localization • Promoter functionality