Download
1 / 24
250 likes | 448 Vues
Economic and Social Dynamics of Transport Sector. Muhammad Aqib Uddin 23 rd Dec 2013, Karachi. Road Transport Sector - Overview.

E N D
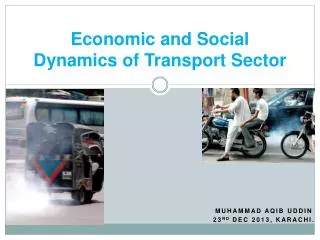
Economic and Social Dynamics of Transport Sector Muhammad Aqib Uddin 23rd Dec 2013, Karachi.
Road Transport Sector - Overview It lays the foundations for how our human settlements function and facilitates commerce between markets. Road transport is intricately linked to the health, economic performance, and social fabric of our contemporary cities.
Road Transport Sector – General • Transport is a peculiar problem: It gets worse as a society gets richer. • Transport demand is likely to be price inelastic.
Road Transport Sector – Costs Transport sector not only imposes internal costs like fuel cost, insurance, vehicle theft prevention system cost and registration etc but also impose external costs. These external costs are in form of; • Accident costs, • Medical costs of local air pollution (hot spots), • Loss of productivity caused by motor vehicle accident injuries or fatalities, and • Time loss by personal and commercial vehicle users due to congestion, etc.
Road Transport Sector – Costs Importantly these costs are borne by individuals and/or society. The main concern is that society is bearing / subsidizing these costs. In Pakistan, the focus has traditionally being towards car-users. Road transport is more than just ‘vehicles’.
Sustainability and Transport Sector All human activities that involve the use of natural resources, like fossil fuel in case of transport sector, cannot go for ever. Therefore, it has been argued that our current motor vehicle based transportation system is non-sustainable, because It uses fossil fuel (finite source of energy), This fuel creates local air-quality problems, This fuel contributes to global warming, The system produces an excessive number of fatalities and injuries, and The system suffers from congestion in major urban areas.
Economic Challenges Economic challenges • Preserve (and enhance) the international competitiveness of country’s business and industry, • Accommodate increased national economic production without imposing externalities, and • Minimise the community (citizens) costs of related externalities in terms of increased air pollution, road crashes, disease burden and urban traffic congestion.
Social Challenges Social challenges • Minimise the risk of ‘flow-on’ economic costs to vulnerable segments of the society, and • Ensure the connectedness and viability of urban and sub-urban communities.
Environmental Justice A final area of interest in the social and economic research realm of transportation is environmental justice. Offshoot of social justice. Its major concern involves situations in which different population groups are affected negatively by a transportation action. The concept of environmental justice arose when toxic or polluting/polluted facilities were sited in or near residential areas of the vulnerable community members.
What is a Good City? A good city shows profound respect for human dignity. A city where people want to be outside. A city that is good for children, women, elderly people, the handicapped and the poor, is good for everybody else. A city that is safe and friendly to pedestrians and bicycles almost certainly is a good city. Cars parked on sidewalks, or parking bays where there should be sidewalk, are symbols of inequality and lack of democracy.
Aim of the Transport Policy? “Transport Policy” aim (Developed vs Developing): • Developed cities: How to reduce car use? – Underpinning the notion of Sustainability! • Developing country’s city: How to facilitate car use? – Unsustainable! What to we want to see? • A city friendly to cars, or a city friendly to people? • Provide efficient mobility for all? • Minimize traffic jams for the higher income groups?
Karachi – In focus The population of Karachi being the fast-expanding mega-city grew annually by 4.2 per cent since 1998, and is projected to grow from 18.9 million in 2010 to 27.6 million in 2020 and 31.6 million in 2030 (Ahmed 2013).
Travel Demand & Vehicle Growth (Karachi) Million 30 28 26 24 22 20 18 16 14 12 10 8 6 4 2 0 24.5 m 16 m 500% increased 5.43 m 5.21 m 0.58 m 1.6 m 2006 1987 Population Trips Vehicle Source: City District Government of Karachi
Vehicles on Road (Pakistan) YearMillion 1980 0.682 1985 1.288 1990 1.990 1995 3.000 2000 4.471 2005 7.084 2007 8.878 2008 9.413 2015 13.127 Source: Pak - EPA
Karachi: 40 persons competing for one bus seat Mumbai: 12 persons competing for one bus seat Hong Kong: 08 persons competing for one bus seat Source: City District Government of Karachi
Percentage Traveling Mode - Karachi 0.00% 17 - Truck 15 - Bus / Others 0.28% 14 - Rail Car 0.06% 16 - Water Launch 0.04% 1- Walk 20.37% 2 - Cycle 1.67% 11 – Minibus / Wagon 55-60% 3 - Motor Cycle 10.18% 4 - Tonga 0.65% 5 - Taxi 0.30% 6 - Rickshaw 1.22% 7 - Car / Jeep 1.74% 8 - Van / pickup 0.62% 9 - Company Owned 2.60% Bus Traveling Mode 10 - Suzuki 0.31% Source: City District Government of Karachi
Percentage Traveling Mode - Karachi • 6% Composition of Public Transport Vehicles carry 55-60% of Total Persons Traveling. • Private Cars which is 29% of Total Vehicular Traffic carries only 22% Persons which shows Lesser Average Vehicle Occupancy.
Counter Intuitive Truths The Earth circles around the sun More road infrastructure brings about more traffic jams Despite having many flyovers! (or stopovers?), Karachi has more traffic jams every year. Solving traffic jams with more or bigger highways is like putting out a fire with gasoline. There are NO elevated highways across the more desirable world cities.
Barriers Identification – Pakistan Specific Institutional Barriers: • No policies that enable development of efficient urban transport • Weak coordination between provincial and city district governments • Lack of exposure to holisticplanning, implementation and enforcement Regulatory Barrier: • Weak regulatory control over municipal growth leading to unplanned settlements and inefficient transport systems • Poor enforcement of vehicle emission standards Financial Barrier: • Lack of government subsidies to support a viable city bus service • Commercial vehicle operators unable or unwilling to obtain finance for fuel efficient commercial vehicles Awareness Barrier: • General lack of awareness on sustainable transport concepts • Lack of awareness of good driving habits and vehicle maintenance that lead to fuel efficiency and clean environment.
Co-benefits of a Sustainable Transportation Air pollution control Congestion mitigation Better mobility CO2 mitigation Energy security Improvement in Road Safety, Equity 20
Economic and Social Benefits – Sustainable Transport System for Karachi Prompt, safe, comfortable and efficient public transport system affordable for all, Overall improvement in green house emissions consequently reducing health expenditure, Reducing travel time of commuters, Greater Economic activity of about 40 transport related industries, More than 5000 direct & indirect skilled/non-skilled job opportunities, Revival / Expansion of local bus manufacturing bus industries, and Support Government’s poverty alleviation program. Source: City District Government of Karachi
BRT Jakarta (Indonesia) ( Corridor 1) GHG savings: 7,195 tons CO2/year Fuel savings: 452,444 gal Time Savings: 1.6 Million US$/Year 22 Source: Dr. HeruSutomo et al.
Important to Remember! • Public transport must compete with better quality and lower prices. • If car use is to be restricted, there must be a good viable and efficient public transport system. • Transport cannot be solved simply with money: It takes changes in our way of life.