Download
1 / 22
220 likes | 308 Vues
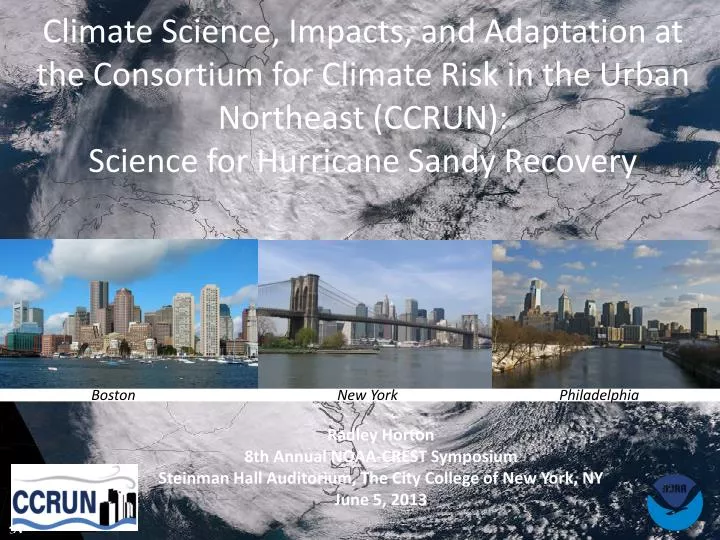
Climate Science, Impacts, and Adaptation at the Consortium for Climate Risk in the Urban Northeast (CCRUN ): Science for Hurricane Sandy Recovery. Boston. New York. Philadelphia. Radley Horton 8th Annual NOAA‐CREST Symposium Steinman Hall Auditorium, The City College of New York, NY

E N D
Climate Science, Impacts, and Adaptation at the Consortium for Climate Risk in the Urban Northeast (CCRUN):Science for Hurricane Sandy Recovery Boston New York Philadelphia Radley Horton 8th Annual NOAA‐CREST Symposium Steinman Hall Auditorium, The City College of New York, NY June 5, 2013
CCRUN Project Sphere Coordination & Outreach Water Coasts Health Climate Indicators, Monitoring & Evaluation Opportunities • Vulnerability • Adaptation • Management Urban Areas 2
Hurricane Sandy as Tipping Point • Leadership in responding to climate change • Municipal, state, and federal alignment • Science in place and in time
Hurricane Sandy Lowest recorded central pressure north of Cape Hatteras, NC at 943 mb • Coastal flood elevations in New York Harbor were the highest in all ~300 years of New York City (and New Amsterdam) history • The storm tide (total water elevation) at The Battery was 13.9 ft, with a peak storm surge of 9.2 ft coming close to high tide • This is about 5 ft above many of the area’s lower sea walls. Storm track forecasts Exceptionally large wind field tropical storm force winds over ~500 miles from the center Storm forecast well in advance
Hurricane Sandy Forecasting the Impacts Climate Change and a Global City 2001 The Potential Consequences of Climate Variability and Change Metro East Coast (MEC) July 2001 Interdependent Critical Infrastructure Systems and Vulnerable Communities South Ferry Subway Station Beach erosion and boardwalk damage in the Rockaways Spencer Platt Getty Images Extensive power outages Hardest hit areas Many impacts forecast well in advance
New York City Adaptation Process 2008 - 2011 Leadership Mayor Coordination Implementation City-wide Sustainability Office OLTPS • City Agencies • Regional Authorities • Private Stakeholders E • University scholars and private sector experts • Social, biological, and physical scientists • Legal and insurance experts • Risk management professionals T Stakeholder Task Force CCATF Expert Panel NPCC P W W C • Integration across Sector-specific Working Groups • Energy (E) - Transportation (T) • Policy (P) -Water & Waste (WW) • - Communications (C) Climate Science Source: NPCC, 2010 6
Hurricane Sandy Immediate Preparations New York City issued mandatory evacuation of Zone A on October 28, 2012 Out-of-state utility crews brought in before the storm Evacuation – Not complete 43 people died in NYC Utilities – Not prepared 4 million without power MTA/DOT – Major flooding 7 subway lines under East River, 3 tunnels closed MTA closed down operations and boarded and placed sandbags at subway entrances to protect against flooding
Hurricane Sandy Less-Anticipated Impacts • Gas shortages • Hospital evacuations • Fires William Perlman/The Star-Ledger John Minchillo, AP Jon Eiseman
Documenting and Studying the Impacts High Water Mark at South Street Seaport Damaged Home in Staten Island Somayya Ali, Columbia University Phil Orton, Stevens Institute of Technology Boardwalk and Beach Damage in Rockaway Park, Queens, NY South Ferry Subway Station in Manhattan Gary Monitz, Columbia University Daniel Bader, Columbia University
CCRUN Tracked the Storm New York Harbor Observing and Prediction System (NYHOPS Model), Stevens Institute of Technology Storm surge forecast Wind speed observations from NYCMetNet CUNY/ NOAA Cooperative Remote Sensing Science and Technology Center (CREST)
Hurricane Sandy Links to Climate Change Science Sea level rise at Battery, NYC 1900-2009, NPCC • ~1 ft of sea level rise in past 100 years in New York metropolitan region, due to local land subsidence, global thermal expansion of ocean water, melting of land-based ice, and local surface elevation • Hurricane Sandy is defined as a 1 in • multi-century event in current climate – • Coastal flooding projected to occur more frequently and to greater extent in future due to sea-level rise alone • Frequency of intense hurricanes in the North Atlantic may increase in future* • Arctic sea-ice may influencing the jet stream, possibly making westward-turning storm tracks more likely** • **Areas of active research North Atlantic SSTs and Hurricane Power Dissipation Index 1950-2005, Emmanuel Median Minimum Sea Ice Extent 1979-2009
Arctic Sea Ice has been decreasing rapidly; more rapidly than projected by climate models Change in winter snow cover (%) corresponding to a 1 million square km decrease in autumn arctic sea ice area Source: NPCC, 2010 Liu et al., PNAS 2012
CCRUN Post-Hurricane Sandy Research AgendaWeather and Climate • Key areas to research include: • Assess progress in forecast skill. • Evaluate historical flood heights, including those of Hurricane Sandy, to see if 1/100 storm height needs to be revised. • Research the influence of large-scale changes on hurricane strength and path (e.g., changes in North Atlantic Ocean temperatures, interactions with mid-latitude storms, and changes in large-scale steering patterns). • Investigate how climate change may affect future storms and their impacts as sea levels rise.
CCRUN Post-Hurricane Sandy IntegratedResearch AgendaVulnerability and Adaptation • Study the determinants of social resilience to coastal flooding in urban neighborhoods and why vulnerability and resilience differ across communities that experience the same flood levels. • Research whether poorer people suffer larger impacts and are less able to recover than the less poor, and whether poverty magnifies vulnerability only in some contexts, such as in public housing with its complexity of exacerbating factors. • Examine the interactions between characteristics of households, communities, and institutions that create different patterns of vulnerability in different communities and how city and neighborhood agencies can help to build resilience in communities that experience different types of vulnerability. • Collect data within communities that document why people did or did not evacuate, why they did or did not prepare, how and why coping strategies and assistance received differed across neighborhoods, how obstacles faced differed across neighborhoods, and how and why the economic impacts differed across neighborhoods. • Monitor how and why the recovery process proceeds differently in different neighborhoods.
CCRUN Post-Hurricane Sandy Research AgendaCoastal Zones • Key research topics include: • Develop new metrics of coastal storm risk that communicate danger better, e.g., how can we translate ‘storm-surge height’ into ‘flood danger’ or other human-scale metrics; include danger from waves in communications as well as surge. • Create high-fidelity web-based models of street-level flooding. • Evaluate role and extent required of wetlands and other ecologically-based adaptation approaches in absorbing coastal flooding and wave damage. • Conduct assessment of storm-surge barriers, in regard to feasibility and economic, environmental, and social costs and benefits. • Design and assess protective measures such as subway and tunnel closures; raising of power stations, etc. • Evaluate role of policies, planning, design, and insurance in developing resilient coastal communities. • Develop and test geoengineering approaches to reducing intensity of hurricanes.
CCRUN Post-Hurricane Sandy Research AgendaWater Resources • With the occurrence of extreme precipitation events associated with hurricanes and storms, new analysis is needed to improve and update the Intensity – Duration – Frequency (IDF) curves used to design stormwater and sewer systems. Innovative approaches include: • Analyze high-resolution data to update exposure to extreme precipitation events over the storm sewer network. • Stochastic simulations of potential simultaneous or discrete exceedences of a specified rainfall intensity-duration can be generated to facilitate several scenario analyses.
CCRUN Post-Hurricane Sandy Research AgendaPublic Health • Hurricane Sandy caused over 110 deaths spread over 9 northeastern states. • These figures do not account for longer term health problems that are likely to emerge over time: mold-related respiratory disease, gastrointestinal infections from contaminated water, and a range of mental health outcomes, to name a few. Research is urgently needed into measures that can reduce both the immediate and longer term health impacts of future storm events in the NE. This research will be enhanced by partnerships between health and climate scientists, along stakeholder organizations and the public. • Epidemiology of the immediate deaths that occurred, as well as the evacuation of the hospitals
CCRUN Post-Hurricane Sandy Research AgendaGreen Infrastructure • Research the effectiveness of the northeast region’s portfolio of green infrastructure. Questions include: • Can real damages associated with hurricane Sandy be correlated with the degree to which green infrastructure was interspersed within or surrounded specific regional development clusters? • What types of damages were averted due explicitly to the presence of green infrastructure? • Did the placement, density, or type of green infrastructure relative to the position both of the coastline and specific urban clusters play a role in the extent to which GI was able to provide damage reduction? • What kind of impacts did Hurricane Sandy have on regional green infrastructure? How long will it take for the green infrastructure to rebound? • Did the presence of green infrastructure actually increase any risks to human communities, for example falling trees?
CCRUN Policy Interactions • CCRUN is providing New York City with updated climate change scenarios for rebuilding • Mayor’s Special Initiative on Rebuilding Hardest Hit Areas • Commission on Buildings; climate information for new regulations • Metropolitan Transportation Authority; Chief Engineers • CCRUN extended ClimAID projections to 2100 for New York State Commissions convened by Governor Cuomo Emergency Readiness, 2100 Infrastructure, Interactive Systems Response, • Coordination efforts underway to link Federal coastal mapping with local sea level rise information
Cities and Climate Change Moving Forward – At Doha and Beyond Shanghai, China Hyderabad, India Esmeraldas, Ecuador • Embed cities first responders role in climate change mitigation and adaptation into international agreements • Enhance science base • Link to emerging Sustainable Development Goals • Develop and implement common sets of standards for reporting – Greenhouse gas emissions and reductions (underway); Impacts of climate on cities; Adaptations • Develop innovative multi-jurisdiction financing measures for mitigation and adaptation • Engage citizens – Bottom-up approach • Especially those from the poorest and most vulnerable urban neighborhoods who are already suffering the most from climate change
References and Links • Consortium for Climate Risk in the Urban Northeast (www.ccrun.org) • NYSERDA ClimAID (www.nyserda.ny.gov/climaid) • New York City Panel on Climate Change report available online at (www.nyas.org) NPCC