Download
1 / 14
140 likes | 257 Vues
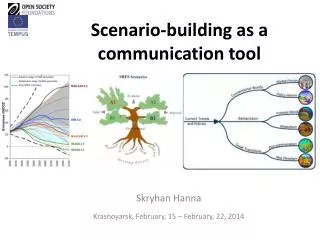
The Virginia Assessment Scenario Tool (VAST), developed by the Interstate Commission on the Potomac River Basin, is a comprehensive framework designed to assist jurisdictions in creating effective load reduction strategies for the Chesapeake Bay. VAST identifies Best Management Practices (BMPs) that yield the highest load reductions, facilitating stakeholder involvement and adaptive processes. The tool produces critical inputs for the Chesapeake Bay Program’s Scenario Builder and supports continuous management of data and implementation evaluations, ensuring effective targeting of BMP applications to maximize environmental benefits.

E N D
Virginia Assessment Scenario ToolVAST Developed by: Interstate Commission on the Potomac River Basin
VALUE FOR JURISDICTIONS • Builds load reduction strategies (by local area) • Identifies the BMPs that give the greatest load reductions • Specifies the extent these BMPs are to be implemented • Meets the allocations • Compares among scenarios • Produces CBP Scenario Builder model inputs • Assesses WIPs and 2-Year Milestones
VAST FEATURES • Is Replicable , Consistent, and Transparent • Consistent with EPA Phase 5.3.2 and WIP Phase II • Available/approved load reduction practices with efficiencies • Continuous no-till is calculated differently than the Chesapeake Bay Program • Serves as a data management system • Facilitate stakeholder involvement, teach stakeholders implications of decisions • Facilitate an adaptive process, scenario development is iterative
PLANNING YOUR SCENARIO What do I need to know? • Chesapeake Bay Program vocabulary • Land Use names • BMP names • Initial idea of which BMPs you want to implement • VAST will help you refine BMP choices You don’t have to know how the BMPs are calculated. • VAST does the calculations for you. • Documentation on the website steps through all the BMPs calculations.
VAST Outputs • Land use acres available • Changes in the acres of each land use • BMPs submitted • Lists the BMPs in your scenario • Shows your notes for each BMP. The notes field is your justification. • Shows which BMPs it was not possible to credit • Loads for each land use • Edge of stream (EOS) • Delivered to the Chesapeake Bay (DEL) • Inputs to the Chesapeake Bay Program’s Scenario Builder
Data Input sequence LOG IN SCENARIO DETAILS SCENARIO LIST URBAN BMPs SEPTIC BMPs WASTE WATER FOREST BMPs AGRICULTURAL BMPs ANIMAL BMPs MANURE TRANSPORT SUMMARY COMPARE SCENARIOS
FINE TUNE TO MAXIMIZE REDUCTIONS • Calculations and the sequence in which they are done are critical—And VAST does them for you! • Target implementation to areas where the pre-BMP load and the delivery to the Bay is highest • Land use change BMPs provide more of a reduction than effectiveness value BMPs because they are always calculated before effectiveness value BMPs, where the pre-BMP load is similar • Effectives BMPs are calculated after the land use changes, so prioritize land use change BMPs since they will be applied to the greater portion of land • Where BMPs are mutually exclusive (in the same group in the table, such as with NM), prioritize the BMP in the group with the higher effectiveness. • Nutrient Management • Stormwater practices • Cover crops
Reference material • General Features and Users Guide • Available via the link on the VAST website • BMP Definitions • Chesapeake Bay Program Land Use Definitions • BMP Calculation Sequence and Groups • BMP effectiveness values by land use and HGMR and pollutant • And more.
Future Refinements • Users input acres or percent implementation • BMP costs • Data Quality • P on AFO/CFO • Improved estimation of animal BMPs • Additional testing • Speed—upgrade tool to accommodate increased usage, larger scenarios • Show results as percent implementation, not just loads • Continued technical support and updating documentation
Olivia DevereuxInterstate Commission on the Potomac River Basin/ Potomac Valley Conservancy District301-274-8114odevereux@icprb.org
Virginia’s Phase II ApproachLocal Deliverables & Deadlines • Desired local deliverables • Current BMPs • Update progress in current model • Land Use / Land Cover • Work with EPA for use in Phase 6 model • 2017/2025 BMP Scenarios • Strategies to implement BMP scenarios • Resource needs • Final opportunity to submit data – Deadline – 2/01/2012 • Incorporation into Final WIP II 12
Assessing Output • The Chesapeake Bay Program’s Watershed Model has some illogical loadings in some locations in Virginia • Use of some BMPs can increase loads in these locations • Nutrient management in Loudoun and Henrico, among others • VAST models the BMPs the same as the Chesapeake Bay Program, so the results may seem illogical
Geographical Areas Not entirely within the Chesapeake Bay Watershed The tool models the state’s portion of the Chesapeake Bay Watershed. The percent implementation the user enters is only for the land use area or number of animals shown in the Pre=BMP table on the left of the BMP screen. The Pre-BMP land use table shows only the portion of the geographical area within the Watershed The animals and manure transport pages show the number of animals in the entire county (data is not available at a finer scale) BMPs entered on the animal pages are applied to the entire number of animals in the county. Manure transport is applied proportionally to the portion of the county in the Watershed