Download
1 / 24
240 likes | 380 Vues
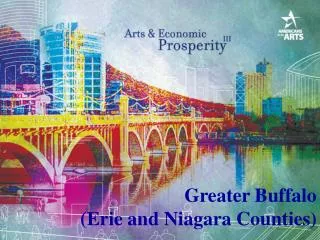
Greater Buffalo (Erie and Niagara Counties). 156 Study Regions— Including Buffalo. Hawaii. Alaska. All 50 States + D.C. . How a Dollar is “Ripples” Through the Community. Nonprofit Arts & Culture A Growth Industry.

E N D
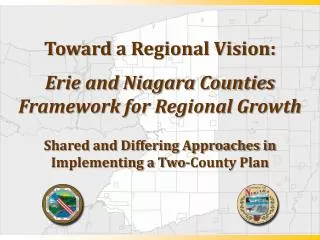
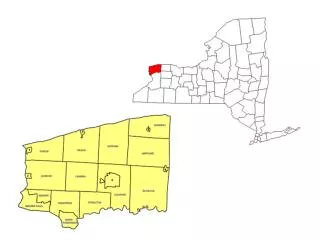
Greater Buffalo (Erie and Niagara Counties)
Hawaii Alaska All 50 States + D.C.
Economic Impact ofNonprofit Arts & Culture Industry$166.2 Billion Annual Expenditures
$35 Government REVENUE $29.6 billion $30 $25 $20 $15 $10 Government FUNDING $4.0 billion $5 $0 Government and the Arts7:1 Return on Investment
Percentage of U.S. WorkforceHow Nonprofit Arts & Culture Stacks Up . . .
Nonprofit Arts & Culture Industry in Greater Buffalo$155.3 Million Annual Expenditures
Nonprofit Arts & Culture Organizations in Greater Buffalo $93.0 Million Annual Expenditures
Nonprofit Arts & Culture Audiences in Greater Buffalo $62.3 Million Annual Expenditures
Nonprofit Arts & Culture Attendees in Greater BuffaloSpend $19.05 Per Person, Per Event
Nonprofit Arts & CultureAttendees in Greater Buffalo Local vs. Nonlocal
Event-Related Spending in Greater BuffaloLocal vs. Nonlocal Audiences
How Greater Buffalo Stacks Up . . .Spending by Organizations Buffalo $93.0 million Similar Regions $103.0 million (N=35)
How Greater Buffalo Stacks Up . . .Spending by Audiences Buffalo $62.3 million Similar Regions $88.6 million (N=35)
How Greater Buffalo Stacks Up . . .Spending by Audiences(Per Person, Per Event, Excluding Admission) Buffalo $19.05 Similar Regions $23.47 (N=35)
How Greater Buffalo Stacks Up . . .Ratio of Local vs. Nonlocal Audiences Buffalo 87% vs. 13% Similar Regions 62% vs. 38% (N=35)
How Greater Buffalo Stacks Up . . .Spending by Local vs. Nonlocal Audiences Buffalo $16.99 vs. $33.00 Similarly Regions $17.30 vs. $40.53 (N=35)
Nonprofit Arts & Culture Industry in Greater Buffalo • A Local Industry • Attracts Audiences • Stimulates Business Development • Supports Jobs • Generates Government Revenue
The Arts Mean Business!www.AmericansForTheArts.org/EconomicImpact