Download
1 / 21
210 likes | 332 Vues
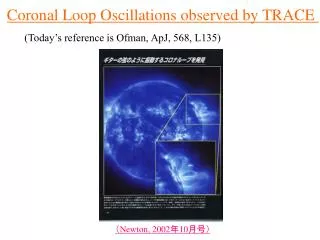
This study analyzes the moat flow surrounding sunspot NOAA 10886, observed using TRACE filters on May 27, 2006. The outflow velocities in the moat were found to be around 300-500 m/s for the normal penumbra, with moving magnetic features reaching up to 2 km/s. Employing Local Correlation Tracking (LCT), we detail the dynamics in both white light and UV wavelengths, revealing significant velocity differences. The results enhance our understanding of solar dynamics and suggest avenues for future research involving higher spatial resolution methods.

E N D
The Moat Flow Observed in Two Different TRACE-Filters Horst Balthasar Astrophysikalisches Institut Potsdam 1 July 2008
Partner involved: • Karin Muglach, ARTEP, NAVAL Research Laboratory
Reasons for these investigations The moat flow is well known. Outflow around sunspots with ´normal´ penumbra of ~300-500 m/s Moving magnetic features (MMF) with up to 2 km/s. There are extended polarimetric investigations of a special small sunspot with VTT and THEMIS (see Hauskolloquium 2007). Question: Can we learn something about the dynamics in and around this sunspot?
Observations Sunspot NOAA 10886, 27 May 2006 Wavelength: TRACE-filters, WL and UV 170 nm. UV is formed next to the temperature minimum. Cadence: 1 minute, 409 images each. Duration: 6 h 40 m, 00:39 - 07:19 UT Pixel width: 0.5 arcsec. Data are corrected for spikes (hot pixel, particle events,....) Solar rotation and TRACE-orbit effects are removed. Solar oscillations are filtered out in WL, but not in UV.
The sunspot AR 10886 27 May 2006 hl=7N, cmd~0 VTT with AO! combined from spectral continuum of 3 scans
Mean Images Left: Whitelight Right: UV 170 nm (log)
The magnetic field Total magnetic field strength derived from the two lines: Upper panel: Si 1078.6 Max: 2180 G Min(PU): 316 G Lower panel: Fe 1078.3 Max: 2308 G Min(PU): 423 G
Gamma Magnetic inclination for Si 1078.6 (upper panel) and Fe 1078.3 (lower panel). The field is less inclined in higher layers.
Mean Images Left: Whitelight Right: UV 170 nm (log)
Local Correlation Tracking Local correlation tracking (LCT) is a well-established technique to determine proper motions. Select a subfield in one image, identify it by best correlation in another image. Here: delta t = 8 min.
LCT Results LCT delivers horizontal velocities in Cartesian coordinates, 401 maps each. These values are transformed into a radial and a tangential component. Averaging all 401 maps.
LCT 4 Box width: 4 Pixel Upper panels: WL Lower: UV Left: radial component, Right: tangential component.
LCT 4 Box width: 4 Pixel Subfield 220 x 200 Upper panels: WL Lower: UV Left: radial component, Right: tangential component.
LCT 10 Box width: 10 Pixel Upper panels: WL Lower: UV Left: radial component, Right: tangential component.
LCT 10 Box width: 10 Pixel Subfield 220x 200 Upper panels: WL Lower: UV Left: radial component, Right: tangential component.
Radial dependence Intensity, radial and tangetial velocity component, averaged over azimuth. Solid line: whitelight, dashed: UV 170 nm. Dotted: error ranges. (for boxsize 4 pixels)
Radial dependence Same as before but for boxsize 10.
Summary • We see an outflow everywhere in the moat. • For the inner moat we find higher velocities in UV, and vice versa in the outer moat. • Both outflow curves, WL and UV, reach zero at the same distance from the spot center. • The velocities are higher if a larger tracking box is selected. • Compared to other spots, this moat is rather extended (~4 radii)
Outlook • Comparison with other methods ( Fisher & Welsch, or Bovelet & Wiehr). • New observations with 2D-spectropolarimeters. • Need of higher spatial resolution GREGOR