Inventory Accounting: Methods and Profit Effects
Learn how to apply various inventory costing methods such as LIFO, FIFO, and more to impact profit and inventory valuation. Understand the lower-of-cost-and-net-reliable-value rule. Estimates ending inventory using different methods.


Inventory Accounting: Methods and Profit Effects
E N D
Presentation Transcript
Retail Inventory Chapter 9 HORNGREN ♦ HARRISON ♦ BAMBER ♦ BEST ♦ FRASER ♦ WILLETT
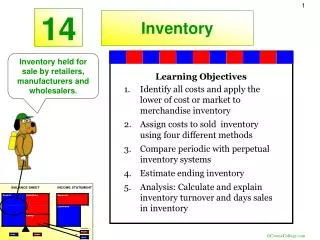
Objectives 1 Account for inventory by the physical and perpetual systems. 2. Apply the inventory costing methods: specific unit cost, weighted average cost, FIFO and LIFO 3. Identify the profit effects of the inventory costing methods
Objectives 4. Apply the lower-of-cost-and-net-reliable-value rule to inventory 5. Determine the effects of inventory errors on cost of goods sold and net profits 6. Estimate ending inventory by the gross profit and retail inventory method
Account for inventory by the periodic and perpetual systems Objective 1
Inventory Accounting Systems Perpetual systems maintain a running record to show the inventory on hand at all times. Periodic systems do not keep a continuous record of inventory on hand.
Perpetual System Debit Inventory Credit Cash or Accounts Payable Debit Cash or Accounts Receivable Credit Sales Revenue Debit Cost of Goods Sold Credit Inventory
Perpetual System(see page 369 text) Item: Sandals Quantity Quantity Quantity Date Received Sold on Hand Nov. 1 5 7 12 26 30 Totals 25 25 50 6 13 21 40 10 4 29 16 41 20 20
Periodic SystemCost of Goods Sold Beginning Inventory $100,000 Net Purchases $560,000 + = Ending Inventory $120,000 Cost of Goods Available for Sale $660,000 Cost of Goods Sold $540,000 – =
Gross Profit Sales revenues – Cost of goods sold = Gross profit (before operating expenses) Gross profit – Operating expenses = Net profit
Cost-of-Goods-Sold Model Budgeted Cost of Goods Sold + Budgeted Ending Inventory Budgeted Cost of Goods Available for Sale = – Actual Beginning Inventory = Purchases
Calculating the Cost of Inventory • Physical count is made at least once a year, even with a perpetual system. • Consigned goods are excluded. Cost of inventory on hand = Quantity × unit cost
Periodic System • At the end of the period make a physical count and apply unit cost to determine ending inventory. • Inventory purchases are debited to the purchases account. • The inventory account carries the beginning inventory balance until adjusted at period end.
Periodic System Inventory Purchases 100,000 Beginning Balance 100,000 Beginning Balance 560,000 Purchases 560,000 Purchases 120,000 Ending Balance Cost of Goods Sold 120,000 Ending Balance 100,000 560,000 540,000 Accounts Payable 560,000 Purchases
Apply the inventory costing methods: specific unit cost, weighted-average cost, FIFO and LIFO Objective 2
Units Purchased in 2004 January 8 20 units @ $20 = $ 400 May 19 55 units @ $30 = $1,650 October 23 25 units @ $31 = $ 775 Total units 100 Units sold 70 Units left 30
Units Sold and in Ending Inventory Units sold by date: Jan 5 17 May 19 33 Oct 23 20 Total sales 70 30 units left in inventory
Specific Identification 20 Units @ $31 5 Units @ $31 Cost of Goods Sold Oct 23 $ 620 May 19 990 Jan 5 340 Total $1,950 33 Units @ $30 22 Units @ $30 17 Units @ $20 3 Units @ $20
Specific Identification 20 Units @ $31 5 Units @ $31 Ending Inventory Oct $155 May 660 Jan 60 Total $875 33 Units @ $30 22 Units @ $30 17 Units @ $20 3 Units @ $20
Weighted Average 25 Units @ $31 (Oct) = $ 775 = 1,650 = 400 = $2,825 Total Cost 55 Units @ $30 (May) 20 Units @ $20 (Jan) 100 Total Units
Weighted Average $2,825 total cost/100 units = $28.25/unit Cost of goods sold = 70 × $28.25 = $1977.50 Ending inventory = 30 × $28.25 = $847.50
First-In, First-Out 25 Units @ $31 (Oct) Cost of Goods Sold Jan $ 400 May 1,500 Total $1,900 5 Units @ $30 (May) 50 Units @ $30 20 Units @ $20 (Jan)
First-In, First-Out 25 Units @ $31 (Oct) Ending Inventory Oct $775 May 150 Total $925 5 Units @ $30 (May) 50 Units @ $30 20 Units @ $20 (Jan)
Last-In, First-Out 25 Units @ $31 (Oct) Cost of Goods Sold Oct $ 775 May 1,350 Total $2,125 45 Units @ $30 (May) 10 Units @ $30 20 Units @ $20 (Jan)
Last-In, First-Out 25 Units @ $31 (Oct) Ending Inventory Oct $300 May 400 Total $700 45 Units @ $30 (May) 10 Units @ $30 20 Units @ $20 (Jan)
Comparison of Methods EndingInventory Specific identification $875.00 FIFO $925.00 LIFO $700.00 Weighted-average $847.50
Comparison of Methods Cost of Goods Sold Specific identification $1,965.00 FIFO $1,900.00 LIFO $2,125.00 Weighted-average $1,977.50
Comparison of Methods Gross Profit from Sales: Specific identification $1,035.00 FIFO $1,100.00 LIFO $ 875.00 Weighted-average $1,022.50 When prices are rising LIFO produces the lowest income and lowest income tax.
Identify the profit effects of the inventory costing methods Objective 3
The Income TaxAdvantage of LIFO • During periods of inflation, LIFO’s income is the lowest. • The most attractive feature of LIFO is reduced income tax payments. • That is probably why it cannot be used not tax (and financial reporting purposes) in Australia!
Perpetual System FIFO Example • Many companies keep their perpetual inventory records in quantities only. • Other companies keep perpetual records in both quantities and dollar cost.
Perpetual System FIFO Example(see page 379 text Deckers Outdoor Item: Wambat Sandals Received Sold Balance on Hand Unit Unit Unit Date Qty. Cost Total Qty. Cost Total Qty. Cost Total Nov. 1 10 $30 $300 5 6 $30 $180 4 30 120 7 25 $31 $775 4 30 120 25 31 775 12 4 30 120 9 31 279 16 31 496
Perpetual System FIFO Example Deckers Outdoor Item: Teva Sandals Received Sold Balance on Hand Unit Unit Unit Date Qty. Cost Total Qty. Cost Total Qty. Cost Total Nov. 26 25 $32 $ 800 16 $31 $496 25 32 800 30 16 $31 496 25 32 800 5 32 160 20 32 640 Totals 50 $1,575 40 $1,235 20 $32 $640
Accounting Principles: Comparability The business should use the same accounting methods and procedures from one period to the next. A company may change inventory methods, but it must disclose the effects of the change on net profits.
Accounting Principles: Relevance The financial statements should report sufficient information to enable an outsider to make knowledgeable decisions about the company.
Accounting Principles: Materiality An item is material if it has the potential to alter a statement user’s decision. Materiality is specific to the entity being evaluated.
Accounting Principles: Conservatism Err on the side of caution when reporting any item in the financial statements.
Apply the lower-of-cost- and-net-realisable-value rule to inventory Objective 4
Lower-of-Cost-and-N-R-V • An asset is reported at the lower of its historical cost or market (replacement) value. • If the replacement cost falls below its historical cost, the business must write down the value of its inventory.
Lower-of-Cost-and-N-R-V Example • Cost of inventory: $3,000 • Market value at balance sheet date: $2,200 • What is the journal entry? June 30 Loss on Inventory (or COGS) 800 Inventory 800 Write down inventory to LCNRV
Determine the effects of inventory errors on cost of goods sold and net profit Objective 5
Inventory Errors • If inventory is calculated incorrectly, how many years of financial statements will it affect? • Two years • The current year’s ending inventory is next year’s beginning inventory.
Estimate ending inventory by the gross profit and retail inventory method Objective 6
Gross Profit Method Example Net Sales $150,000 Gross Profit Margin 31.5% Beginning Inventory $ 18,500 Net Purchases $110,500 Net Sales $150,000 – Gross Profit of 31.5% 47,250 = Cost of Goods Sold $102,750
Gross Profit Method Example Beginning Inventory $18,500 Net Purchases $110,500 + = Ending Inventory $26,250 Cost of Goods Available for Sale $129,000 Cost of Goods Sold $102,750 – =
Retail Inventory Method • Businesses with high turnover, low cost inventory, AASB 1019 allows the use of the retail inventory method. • Like the gross profit method it is based on the COGS model. • Requires the recording of inventory purchases at cost and at retail (selling) price. • See exhibit 9-13 page 385 of you text book.
Internal Control over Inventory • Physically counting inventory (stocktake) • Safe storage • Separate inventory and accounting records • Keeping perpetual inventory records • Sufficient inventory to prevent stock-outs • Not too much inventory – avoid obsolesce • Economic order quantities • Investigate just-in-time inventory systems.