Diagnostics
This guide delves into essential concepts of linear regression diagnostics, focusing on critical assumptions including linearity and homoscedasticity. Learn how to identify these assumptions, detect potential issues like outliers and leverage, and assess the quality of your regression model through residual analysis. Discover the importance of standardized and studentized residuals in ensuring a reliable representation of your data. By understanding these key elements, you can improve the accuracy and validity of your regression analyses.

Diagnostics
E N D
Presentation Transcript
Diagnostics Checking Assumptions and Bad Data
What is the linearity assumption? How can you tell if it seems met? What is homoscedasticity (heteroscedasticity)? How can you tell if it’s a problem? What is an outlier? What is leverage? What is a residual? How can you use residuals in assuring that the regression model is a good representation of the data? Why consider a standardized residual? What is a studentized residual? Questions
Linear Model • Linear relations b/t X and Y • Normal distribution of error of prediction • Homoscedasticity (homogeneity of error in Y across levels of X)
Good-Looking Graph No apparent departures from line.
Same Data, Different Graph No systematic relations between X and residuals.
Problem with Heteroscedasticity Common problem when Y = $
Outliers Outlier = pathological point
Review • What is the linearity assumption? How can you tell if it seems met? • What is homoscedasticity (heteroscedasticity)? How can you tell if it’s a problem? • What is an outlier?
Residuals • Zresid • Look for large values (some say |z|>2) • Studentized residual (Student Residual): The studentized residual considers the distance of the point from the mean. The farther X is from the mean, the smaller the standard error and the larger the residual. Look for large values. Also, studentized deleted residual (RStudent).
Influence Analysis • Leverage: • Leverage is an index of the importance of an observation to a regression analysis. • Function of X only • Large deviations from mean are influential • Maximum is 1; min is 1/N • Average value is (k+1)/N, where k is the number of IVs
Influence Analysis (2) • DFBETA and standardized DFBETA • Change in slope or intercept resulting when you delete the ith person. • Allow for influence of both X and Y
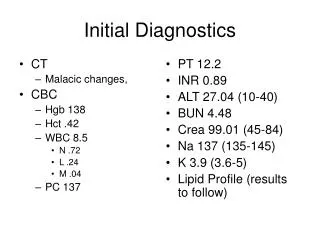
Example r = .82; r2 = .67; p < .05. X Y SX = 1.95, SY = 2.41 b=1.01, a=-1.34 M=
Remedies • Fit Curves if needed. • Note heteroscedasticity for applied problems. • Investigate all outliers. May delete them or not, depending. Report your actions.
Review • What is leverage? • What is a residual? • How can you use residuals in assuring that the regression model is a good representation of the data? • Why consider a standardized residual? • What is a studentized residual?