Download

1 / 34
340 likes | 458 Vues
Speed vs. Velocity. Reviewing Key Concepts pg. 347. 1a. What is speed? Speed is distance traveled per unit time. b. What is the average speed of a car that travels 160 km in 2 hours? 80 km/h

E N D
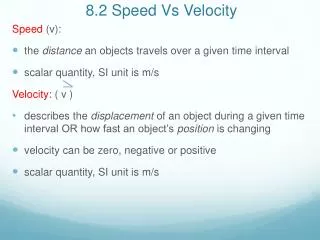
Reviewing Key Concepts pg. 347 1a. What is speed? Speed is distance traveled per unit time. b. What is the average speed of a car that travels 160 km in 2 hours? 80 km/h c. If you walked at an average speed of 1.2 m/s, how long would it take to cross a road that is 16-m wide? Note: units m ms 16 m ∙ = 13 1/3 s = m 1 m 1.2 m/s s
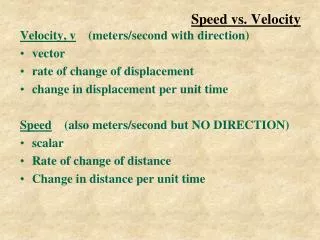
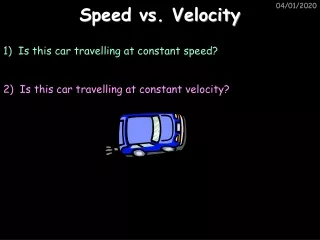
2a. What is velocity? Velocity is speed in a given direction. b. Describe the two ways in which velocity can change. Velocity can change in speed or direction or both. c. Your car’s speedometer reads a constant 35 mi/hr. Can you say your velocity isconstant? Explain. Probably not. The question does not give information about change (or no change) in direction. Velocity involves both speed and direction.
3a. What does the slope of a distance-versus-time graph show you about the motion of an object? The slope of a distance-versus-time graph shows you the speed of the moving object. b. The rise of a line on a distance-versus-time graph is 600 m and run is 3 minutes. What is the slope of the line? The slope is 200 m/min.
When you measured the speed of a cart rolling down a track, do you think the carts were going the same speed the whole time? The cart started at rest (0 cm/s) It then sped up to its top speed down the ramp It eventually slowed down until it stopped came to rest (0 cm/s) You found the AVERAGE SPEED INSTANTANEOUSSPEED is the speed at any given moment in time (speedometer).
In this activity... You will analyze graphs of distance versus time that show motion over a whole trip. The motion may be different throughout the trip. Notice on pg. E-12, the road to school is a straight road and does not require any turning. This activity focuses on linear motion only.
Read E-12 Problem: How can you use a graph to describe motion? Hypothesis: If you _____________, then you ____________________.
What do you know about reading a motion graph? x-axis is time Y-axis is distance Distance (mi) Time (hr)
Procedure Trip Slips – figure out where they go on the graphs! You will be exploring how the slope on the graph relates to speed. You will also analyze graphs of distance versus time that show motion over a whole trip, as opposed to determining one average speed over a trip
What do the changes in the graph’s slopes on a distance-versus-time graph mean?
Background information: A straight line indicates a constant speed. A positive (upward) slope means the car is moving away from the reference point (home), or positive velocity A zero slope (horizontal line) is a stopped car. A negative (downward) slope is a car moving back toward the reference point (home), or negative velocity.
Background cont.: A steeper slope indicates a faster speed. A curved line of changing slope indicates linear acceleration, or change in speed. The rate of curvature defines the amount of acceleration.
Slope the change in y (∆y) the change in x (∆x) Slope = the change in the distance (∆d) the time interval (∆t) =
Procedure step #5 • Put your explanation of each persons trip on the back of your template or on separate paper Data/observation: Explanations: Teasha’s Trip: D- The slope of the line is 3 mi/6 min or 0.5 mi/min, which shows the car took 6 minutes to travel 3 miles. Josh’s Trip:
Discussion Are Teasha’s and Josh’s graphs realistic? Do cars usually change speed instantaneously? What would be a more realistic way to draw the graphs?
Distance Distance Time Time Realistic Not Realistic
Analysis Question #5 An object accelerates if it has a change in speed or direction. A distance vs. time graph with a constant slope shows that the speed is constant. If the slope is increasing, the speed is increasing and the car is accelerating.
Distance Distance Time Time Deceleration: slope is decreasing Acceleration: slope is increasing
Graphing Speed: Distance vs. Time Graphs Denver Phoenix
Average speed • Speed is usually NOT CONSTANT • Ex. Cars stop and go regularly • Runners go slower uphill than downhill • Average speed = total distance traveled/total time it took.
Calculating Average Speed • It took me 1 hour to go 40 km on the highway. Then it took me 2 more hours to go 20 km using the streets. • Total Distance: • 40 km + 20 km = 60 km • Total Time: • 1 h + 2 h = 3 hr • Ave. Speed: • total d/total t = 60 km/3 h = 20 km/h
Question • I ran 1000 m in 3 minutes. Then ran another 1000 m uphill in 7 minutes. What is my average speed? • A) 100 m/min • B) 2000 m/min • C) 10 m/min • D) 200 m/min • E) 20 m/min Total Dist. = 1000 m + 1000 m = 2000 m Total Time = 3 min + 7 min = 10 min Ave speed = total dist/total time = 2000m/10 min = 200 m/min= D
Velocity • Velocity – the SPEED and DIRECTION of an object. • Example: • An airplane moving North at 500 mph • A missile moving towards you at 200 m/s
Graphing Speed: Distance vs. Time Graphs Speed = Slope = Rise/Run Rise
Graphing Speed: Distance vs. Time Graphs Speed = Slope = Rise/Run Rise=? 600 km 3 h
Graphing Speed: Distance vs. Time Graphs Speed = Slope = Rise/Run Rise=? 600 km 3 hr Rise/Run = 600 km/3 hr = 200 km/hr
Different Slopes Slope = Rise/Run = 0 km/1 hr = 0 km/hr Rise = 2 km Run = 1 hr Rise = 0 km Run = 1 hr Slope = Rise/Run = 2 km/1 hr = 2 km/hr Rise = 1 km Run = 1 hr Slope = Rise/Run = 1 km/1 hr = 1 km/hr
Question Below is a distance vs. time graph of my position during a race. What was my AVERAGE speed for the entire race? Average Speed = Total distance/Total time = 12 km/6 hr = 2 km/hr Rise = 12 km Run = 6 hr
Question Below is a distance vs. time graph for 3 runners. Who is the fastest? Leroy is the fastest. He completed the race in 3 hours
Acceleration Acceleration = speeding up? Acceleration – the rate at which velocity changes Can be an: Increase in speed Decrease in speed Change in direction
Types of acceleration Increasing speed Example: Car speeds up at green light Decreasing speed Example: Car slows down at stop light Changing Direction Example: Car takes turn (can be at constant speed) screeeeech
Question How can a car be accelerating if its speed is a constant 65 km/h? If it is changing directions it is accelerating
Calculating Speed Worksheet 4 m/s 48 Distance (m) 40 32 24 16 8 0 1 2 3 4 5 6 7 8 9 10 11 12 13 14 Time (s)