Download

1 / 33
340 likes | 495 Vues
Methods, Practice and Teaching of Survey Research. Don Haider-Markel University of Kansas May-June 2005. The Basics: Why Conduct a Survey?. Sampling and Sample Design. Types of Samples and Probability Theory Random Samples Reflecting a population Expense Non-Random Samples

E N D
Methods, Practice and Teaching of Survey Research Don Haider-MarkelUniversity of Kansas May-June 2005
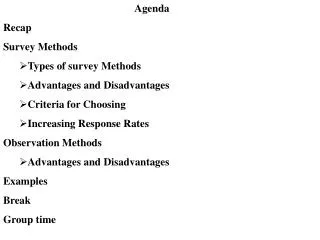
Sampling and Sample Design • Types of Samples and Probability Theory • Random Samples • Reflecting a population • Expense • Non-Random Samples • Stratified Sample • Examples • Quota Samples and Others
Implementing a Sample Design • Issues of Cost • Issues of response rates • Biased sample; reliability • Reducing non-response rates • Traditionally telephone was best (>50%) • Increasingly mail response is the same as telephone; sometimes better (25-35%) • Deciding on a data collection method • Cost, response rate, population characteristics
Designing the Survey Instrument • Defining Objectives • What do you really want to know • Several Questions Related to the issue; triangulate • Example: Attitudes about the U.S. and the West
Designing the Survey Instrument • Question construction • Reliability: Wording • Validity: Are we measuring what we think we are measuring? • Concept versus Measurement
Designing the Survey Instrument • Format and Layout • Order Effects • Appearance on Surveys that the Respondent is Able to view • Example of scenarios
Instrument Length • Ideal is 10 to 15 minutes on telephone or mail survey • Often not possible • At about 30 minutes significant drop-off • Translates into less than 75 non-complex questions
Going Into the Field • Ethical Issues and Consent • Human Subjects Approval • Funding issues • Who is paying and notifying respondents • Training interviewers • Consistency • Professional
Using Survey Data • Returning to the Research Questions • Recall what you wanted to learn
Using Survey Data • Uncovering New Questions • Data patterns are likely to reveal new issues
Using Survey Data • Bivariate versus Multivariate Analysis • Bivariate allows simple way to show relationships • Multivariate allows us to control for alternative explanations
Bivariate • Republicans, independents, and Democrats have different ideas on the origins of homosexuality -- Democrats are more likely to believe it is something a person is born with; Republicans believe it is due to upbringing and environment. • In your view, is homosexuality: something a person is born with, (or is homosexuality) due to factors such as upbringing and environment? ±3 pct. pt. margin of errorMay 2-5, 2005Sample size = 1,005National adults
Multivariate • Table 1. The Determinants of Causal Attributions about the Origins of Homosexuality — Genetics as Cause. • Independent Variables Estimate z • Education .33** 5.30 • (.06) • Age .19** 4.18 • (.04) • Female .58** 4.04 • (.14) • Gay Friend .78** 5.10 • (.15) • Religiosity -.25** - 5.28 • (.04) • Republican - .55** - 3.40 • (.16) • Liberal .36* 2.01 • (.18) • Constant - 2.17** - 6.88 • (.31) • Pseduo R-square .13 • Chi Square 182.65 • N 1041 • Notes: Coefficients are Logistic regression coefficients; standard errors are in parentheses. ** p < .01, * p < .05. The data are from an October 2003 survey conducted by the Pew Center Research Center.
Explaining Margin of Error and Sampling Issues • Need to provide clear methodology • Exact Question Wording
Final Thoughts • Just one research tool • No better or worse than others • Use depends on research questions • Should always try to combine methods and analysis