MACHINE LEARNING TECHNIQUES IN BIO-INFORMATICS
760 likes | 808 Vues
MACHINE LEARNING TECHNIQUES IN BIO-INFORMATICS. Elena Marchiori IBIVU Vrije Universiteit Amsterdam. Summary. Machine Learning Supervised Learning: classification Unsupervised Learning: clustering. Machine Learning (ML).

MACHINE LEARNING TECHNIQUES IN BIO-INFORMATICS
E N D
Presentation Transcript
MACHINE LEARNING TECHNIQUES IN BIO-INFORMATICS Elena Marchiori IBIVU Vrije Universiteit Amsterdam
Summary • Machine Learning • Supervised Learning: classification • Unsupervised Learning: clustering
Machine Learning (ML) • Construct a computational model from a dataset describing properties of an unknown (but existent) system. observations System (unknown) properties ? ML Computational model prediction
Supervised Learning • The dataset describes examples of input-output behaviour of a unknown (but existent) system. • The algorithm tries to find a function ‘equivalent’ to the system. • ML techniques for classification: K-nearest neighbour, decision trees, Naïve Bayes, Support Vector Machines.
Supervised Learning property of interest observations System (unknown) supervisor Training data ? ML algorithm new observation model prediction Unsupervised learning
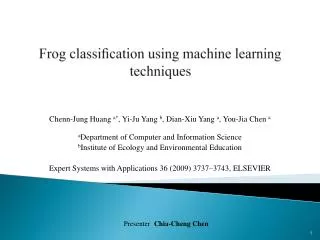
Example: A Classification Problem • Categorize images of fish—say, “Atlantic salmon” vs. “Pacific salmon” • Use features such as length, width, lightness, fin shape & number, mouth position, etc. • Steps • Preprocessing (e.g., background subtraction) • Feature extraction • Classification example from Duda & Hart
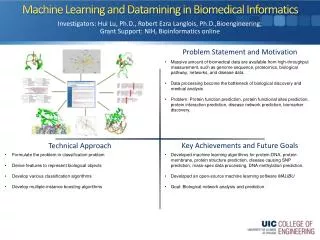
Classification in Bioinformatics • Computational diagnostic: early cancer detection • Tumor biomarker discovery • Protein folding prediction • Protein-protein binding sites prediction From: Introduction to Hierarchical Clustering Analysis, Pengyu Hong
Classification Techniques • Naïve Bayes • K Nearest Neighbour • Support Vector Machines (next lesson) • … From: Introduction to Hierarchical Clustering Analysis, Pengyu Hong
Bayesian Approach • Each observed training example can incrementally decrease or increase probability of hypothesis instead of eliminate an hypothesis • Prior knowledge can be combined with observed data to determine hypothesis • Bayesian methods can accommodate hypotheses that make probabilistic predictions • New instances can be classified by combining the predictions of multiple hypotheses, weighted by their probabilities Kathleen McKeown’s slides
Bayesian Approach • Assign the most probable target value, given <a1,a2,…an> • VMAP=argmax P(vj| a1,a2,…an) • Using Bayes Theorem: • VMAP=argmax P(a1,a2,…an|vj)P(vi) vjV P(a1,a2,…an) =argmax P(a1,a2,…an|vj)P(vi) vjV • Bayesian learning is optimal • Easy to estimate P(vi) by counting in training data • Estimating the different P(a1,a2,…an|vj) not feasible (we would need a training set of size proportional to the number of possible instances times the number of classes) Kathleen McKeown’s slides
Bayes’ Rules • Product Rule P(a Λ b) = P(a|b)P(b)= P(b|a)P(a) • Bayes’ rule P(a|b)=P(b|a)P(a) P(b) • In distribution form: P(Y|X)=P(X|Y)P(Y) = αP(X|Y)P(Y) P(X) Kathleen McKeown’s slides
Naïve Bayes • Assume independence of attributes • P(a1,a2,…an|vj)=∏P(ai|vj)i • Substitute into VMAP formula • VNB=argmax P(vj)∏P(ai|vj) vjV i Kathleen McKeown’s slides
VNB=argmax P(vj)∏P(ai|vj) vjV Kathleen McKeown’s slides
Estimating Probabilities • What happens when the number of data elements is small? • Suppose true P(S-length=low|verginica)=.05 • There are only 2 instances with C=Verginica • We estimate probability by nc/n using the training set • Then #S-length =low |Verginica must = 0 • Then, instead of .05 we use estimated probability of 0 • Two problems • Biased underestimate of probability • This probability term will dominate if future query contains S-length=low Kathleen McKeown’s slides
Instead: use m-estimate • Use priors as well • nc+mp n+m • Where p = prior estimate of P(S-length=low|verginica) • m is a constant called the equivalent sample size • Determines how heavily to weight p relative to the observed data • Typical method: assume a uniform prior of an attribute (e.g. if values low,med,high -> p =1/3) Kathleen McKeown’s slides
K-Nearest Neighbour • Memorize the training data • Given a new example, find its k nearest neighbours, and output the majority vote class. • Choices: • How many neighbours? • What distance measure?
Application in Bioinformatics • A Regression-based K nearest neighbor algorithm for gene function prediction from heterogeneous data, Z. Yao and W.L. Ruzzo, BMC Bioinformatics 2006, 7 • For each dataset k, for each pair of genes p compute similarity fk(p) of p wrt k-th data • Construct predictor of gene pair similarity, e.g. logistic regression H: f(p,1),…,f(p,m) H(f(p,1),…,f(p,m)) such that H high value if genes of p have similar functions. Given a new gene g find kNN using H as distance Predict the functional classes C1, .., Cn of g with confidence equal to Confidence(Ci) = 1- Π(1- Pij) with gj neighbour of g and Ci in the set of classes of gj (probability that at least one prediction is correct, that is 1 – probability that all predictions are wrong)
Classification: CV error N samples • Training error • Empirical error • Error on independent test set • Test error • Cross validation (CV) error • Leave-one-out (LOO) • N-fold CV splitting 1/n samples for testing N-1/n samples for training Count errors Summarize CV error rate Supervised learning
Two schemes of cross validation CV1 CV2 N samples N samples LOO Gene selection Train and test the gene-selector and the classifier LOO Train and test the classifier Count errors Count errors Supervised learning
Difference between CV1 and CV2 • CV1 gene selection within LOOCV • CV2 gene selection before before LOOCV • CV2 can yield optimistic estimation of classification true error • CV2 used in paper by Golub et al. : • 0 training error • 2 CV error (5.26%) • 5 test error (14.7%) • CV error different from test error! Supervised learning
Significance of classification results • Permutation test: • Permute class label of samples • LOOCV error on data with permuted labels • Repeat process a high number of times • Compare with LOOCV error on original data: • P-value = (# times LOOCV on permuted data <= LOOCV on original data) / total # of permutations considered Supervised learning
Unsupervised Learning ML for unsupervised learning attempts to discover interesting structure in the available data Unsupervised learning
Unsupervised Learning • The dataset describes the structure of an unknown (but existent) system. • The computer program tries to identify structure of the system (clustering, data compression). • ML techniques: hierarchical clustering, k-means, Self Organizing Maps (SOM), fuzzy clustering (described in a future lesson).
Clustering • Clustering is one of the most important unsupervised learning processes for organizing objects into groups whose members are similar in some way. • Clustering finds structures in a collection of unlabeled data. • A cluster is a collection of objects which are similar between them and are dissimilar to the objects belonging to other clusters.
Clustering Algorithms • Start with a collection of n objects each represented by a p–dimensional feature vector xi , i=1, …n. • The goal is to associatethe n objects to k clusters so that objects “within” a clusters are more “similar” than objects between clusters. k is usually unknown. • Popular methods: hierarchical, k-means, SOM, … From: Introduction to Hierarchical Clustering Analysis, Pengyu Hong
Hierarchical Clustering Venn Diagram of Clustered Data Dendrogram From http://www.stat.unc.edu/postscript/papers/marron/Stat321FDA/RimaIzempresentation.ppt
Hierarchical Clustering (Cont.) • Multilevel clustering: level 1 has n clusters level n has one cluster. • Agglomerative HC: starts with singleton and merge clusters. • Divisive HC: starts with one sample and split clusters.
NearestNeighborAlgorithm • Nearest Neighbor Algorithm is an agglomerative approach (bottom-up). • Starts with n nodes (n is the size of our sample), merges the 2 most similar nodes at each step, and stops when the desired number of clusters is reached. From http://www.stat.unc.edu/postscript/papers/marron/Stat321FDA/RimaIzempresentation.ppt
Nearest Neighbor, Level 2, k = 7 clusters. From http://www.stat.unc.edu/postscript/papers/marron/Stat321FDA/RimaIzempresentation.ppt
Hierarchical Clustering Calculate the similarity between all possible combinations of two profiles • Keys • Similarity • Clustering Two most similar clusters are grouped together to form a new cluster Calculate the similarity between the new cluster and all remaining clusters. From: Introduction to Hierarchical Clustering Analysis, Pengyu Hong
Clustering in Bioinformatics • Microarray data quality checking • Does replicates cluster together? • Does similar conditions, time points, tissue types cluster together? • Cluster genes Prediction of functions of unknown genes by known ones • Cluster samples Discover clinical characteristics (e.g. survival, marker status) shared by samples. • Promoter analysis of commonly regulated genes From: Introduction to Hierarchical Clustering Analysis, Pengyu Hong
Functional significant gene clusters Two-way clustering Sample clusters Gene clusters
Bhattacharjee et al. (2001) Human lung carcinomas mRNA expression profiling reveals distinct adenocarcinoma subclasses. Proc. Natl. Acad. Sci. USA, Vol. 98, 13790-13795.
Similarity Measurements • Pearson Correlation Two profiles (vectors) and +1 Pearson Correlation – 1 From: Introduction to Hierarchical Clustering Analysis, Pengyu Hong
Similarity Measurements • Pearson Correlation: Trend Similarity From: Introduction to Hierarchical Clustering Analysis, Pengyu Hong
Similarity Measurements • Euclidean Distance From: Introduction to Hierarchical Clustering Analysis, Pengyu Hong
Similarity Measurements • Euclidean Distance: Absolute difference From: Introduction to Hierarchical Clustering Analysis, Pengyu Hong
Clustering C1 Merge which pair of clusters? C2 C3 From: Introduction to Hierarchical Clustering Analysis, Pengyu Hong
Clustering Single Linkage Dissimilarity between two clusters = Minimum dissimilarity between the members of two clusters + + C2 C1 Tend to generate “long chains” From: Introduction to Hierarchical Clustering Analysis, Pengyu Hong
Clustering Complete Linkage Dissimilarity between two clusters = Maximum dissimilarity between the members of two clusters + + C2 C1 Tend to generate “clumps” From: Introduction to Hierarchical Clustering Analysis, Pengyu Hong
Clustering Average Linkage Dissimilarity between two clusters = Averaged distances of all pairs of objects (one from each cluster). + + C2 C1 From: Introduction to Hierarchical Clustering Analysis, Pengyu Hong
Clustering Average Group Linkage Dissimilarity between two clusters = Distance between two cluster means. + + C2 C1 From: Introduction to Hierarchical Clustering Analysis, Pengyu Hong
Considerations • What genes are used to cluster samples? • Expression variation • Inherent variation • Prior knowledge (irrelevant genes) • Etc. From: Introduction to Hierarchical Clustering Analysis, Pengyu Hong
K-means Clustering • Initialize the K cluster representatives w’s, e.g. to randomly chosen examples. • Assign each input example x to the cluster c(x) with the nearest corresponding weight vector: • Update the weights: • Increment n by 1 and go until no noticeable changes of the cluster representatives occur. Unsupervised learning