Download
1 / 1
10 likes | 84 Vues
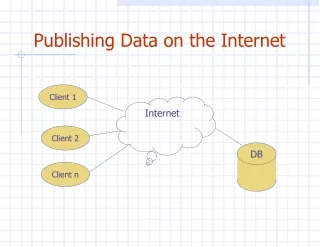
Develop methods and tools for efficient collection, visualization, and publication of environmental data to facilitate scientific discovery.

E N D
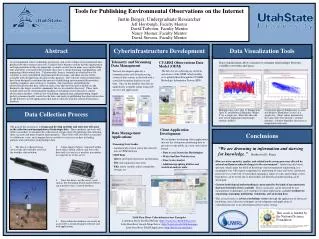
This work is funded by the National Science Foundation This material is based upon work supported by the National Science Foundation under Grant No. 06-10075. Any opinions, findings, and conclusions or recommendations expressed in this material are those of the authors and do not necessarily reflect the views of the National Science Foundation. Tools for Publishing Environmental Observations on the Internet Justin Berger, Undergraduate Researcher Jeff Horsburgh, Faculty Mentor David Tarboton, Faculty Mentor Nancy Mesner, Faculty Mentor David Stevens, Faculty Mentor Abstract Cyberinfrastructure Development Data Visualization Tools Telemetry and Streaming Data Management CUAHSI Observations Data Model (ODM) As environmental sensor technology progresses, and as the volume of environmental data produced by these sensors increases, scientists have begun to realize that the organization and representation of data are important, so much so now that in many cases much of the time and effort associated with scientific discovery is spent obtaining, manipulating, and organizing observational data. Unfortunately, there is currently no standard way for scientists to store and publish environmental observations, and there are few freely-available tools designed specifically for this purpose. The software tools presented here have been designed to automate the process of publishing environmental observations, enabling engineers and scientists to visualize, edit, transform, and publish the observational data that they collect in such a way that they become available via the Internet to the larger scientific community for use in scientific discovery. These tools include software for automating the loading of streaming sensor data into a central observations database, software for visualizing, summarizing, and performing simple quality assurance/quality control on the data, and tools for publishing the observations data on the Internet via web applications that interact directly with the central observations database. Data visualizations allow scientists to examine relationships between variables over time and space. The data we are collecting are stored in an instance of the ODM, which enables us to publish them through the CUAHSI Hydrologic Information System (HIS). We have developed a plan for a communications and data processing system to link sensors in the field with a central observations database in real time. Once in the database, the data are immediately available online using web services and applications. Data Collection Process Multiple time series plot of Temperature (Left Y) and Relative Humidity (Right Y) at a single site. Plots like this one may reveal important relationships among variables. Correlation plot of Temperature (y-axis) and Relative Humidity (x-axis) at a single site. (Only values measured at the same time were plotted.) A trend emerges – relative humidity decreases as temperature increases. The goal of this research is to design and develop methods and tools that will assist in the collection and manipulation of hydrologic data. These methods and tools will allow researchers to automate the collection of certain types of hydrologic data allowing more accurate and more frequent measurements. These tools will also allow researchers to collaborate, view, and compare data in an effort to assist researchers in finding patterns and correlations in hydrologic data. Client Application Development Conclusions Data Management Applications • We are further developing client applications that use the continuous monitoring data or present it to the public in a clear and concise format. • Data Access System for Hydrologists • WaterOneFlow Web Services • Time Series Analyst • Additional graphing utilities and statistical analysis tools. Streaming Data Loader - Automatically stream sensor data directly into an ODM database ODM Tools - Query and export data series and metadata - Plot and summarize data series - Edit, delete, modify, adjust, interpolate, average, etc. 1. The data is collected using devices like this turbidity sensor or the weather station below. 2. A data logger (below) contained within the weather station collects and stores the data until it is sent via a wireless transmitter to a repeater or to the server. “We are drowning in information and starving for knowledge.”Rutherford D. Roger • How are water quantity, quality, and related earth system processes affected by natural and human induced changes to the environment? Addressing this broad question, which spans the fields of hydrology and environmental engineering, in a meaningful way will require comprehensive monitoring of water and water constituent processes over a network of watersheds spanning a range of scales and settings so that hypotheses can be tested and so that models and theoretical understanding can be developed. • Current hydrological understanding is constrained by the kinds of measurements that have heretofore been available. These constraints can be loosened by new measurement technologies, new strategies for their deployment, and new methods for organizing, managing, publishing, visualizing, and analyzing data. • This research seeks to advance hydrologic science through the application of advanced hydrologic data collection techniques and development and application of cyberinfrastructure in an environmental observatory setting. 3. Once the data is on the server, tools such as the Streaming Data Loader (below) can transfer it into a central database. Little Bear River Cyberinfrastructure Examples Little Bear River Test Bed Website (http://water.usu.edu/littlebearriver) Little Bear River Google Maps Server (http://water.usu.edu/littlebearmap) Little Bear River DASH Application (http://his02.usu.edu/dash/) 4. Data within the database can easily be accessed by custom designed software and web applications.