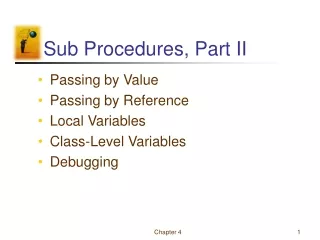
Social Sub-groups II
This outline reviews various strategies for identifying primary groups within social networks, focusing on methods such as Principal Component Analysis (PCA) and factor analysis. Key theorists Wayne Baker and Scott Feld explore the clustering phenomenon within networks and its underlying causes, providing practical software tools for analysis. We’ll dive into methodologies that enhance group detection including search algorithms and edge-betweenness strategies, along with examples from the Add Health and Prosper datasets. Learn how to measure 'groupness' and implement innovative techniques for maximizing fit in social structures.


Social Sub-groups II
E N D
Presentation Transcript
Social Sub-groups II • Outline • “How?” • - Review group-finding strategies • - “Evade” – PCA (=SVD for the math-oriented!) • - Theory Problem: What should group-structure be? • “Why?” • Wayne Baker • Social structure in a place where there should be none • Scott Feld • What causes clustering in a network? Opportunity and interests • Examples from Add Health & Prosper • Practical: • Software & Program examples. • Next week: Roles & Blockmodels
Methods: How do we identify primary groups in a network? Strategies for identifying primary groups: Search: 1) Fit Measure: Identify a measure of groupness (usually a function of the number of ties that fall within group compared to the number of ties that fall between group). 2) Algorithm to maximize fit. Once we have the index, we need a clever method for searching through the network to maximize the fit. See: “Jiggle”, “Factions” etc. Destroy: Break apart the network in strategic ways, removing the weakest parts first, what’s left are your primary groups. See “edge betweeness” “MCL” Evade: Don’t look directly, instead find a simpler problem that correlates: Examples: Generalized cluster analysis, Factor Analysis, RM.
Strategies for identifying primary groups: Search: - UCINET’s Factions - R’s FastGreedy - PAJEK’s Generalized block-modeling - Frank’s KliqueFinder Destroy: Edge-betweenness reduction MCL Flow model Evade: Leading Eigenvector model Clustering Distance (or other) matrix Principle Component / Factor / SVD methods RNM Hybrids: Use a simple evade technique for starting values and then use a search technique. (CROWDS, JIGGLE)
Strategies for identifying primary groups: Evade Factor Analysis: Treat the adjacency/similarity matrix as a set of N variables and look for latent factors that explain the variance in the data. IQ SES 1.0 1.0 Math Score Income 0.0 0.0 d d We often use simple indicators and assume they measure our concepts
Strategies for identifying primary groups: Evade Factor Analysis: Treat the adjacency/similarity matrix as a set of N variables and look for latent factors that explain the variance in the data. IQ SES Income Occupation House Size Highest Degree Languages Spoken Reading Score Math Score d d d d d d d But we don’t have to! We can imagine that each latent concept causes our indicators, and build a measurement model.
Strategies for identifying primary groups: Evade Factor Analysis: Treat the adjacency/similarity matrix as a set of N variables and look for latent factors that explain the variance in the data. But we don’t have to! We can imagine that each latent concept causes our indicators, and build a measurement model.
Strategies for identifying primary groups: Evade Factor Analysis: Treat the adjacency/similarity matrix as a set of N variables and look for latent factors that explain the variance in the data. In a network, we assume that the tie pattern is an imperfect measure of an underlying latent structure that we can explain with similar factors. Instead of lots of “measurements” we have many columns in the adjacency (sim) matrix, and we can summarize that with factor scores. -- works best if the similarity matrix has more information – so multiple account data are perfect. – or you can transform the data in some way to more information (like use a distance matrix.
Strategies for identifying primary groups: Evade Factor Analysis: Treat the adjacency/similarity matrix as a set of N variables and look for latent factors that explain the variance in the data. Here is code I used in the PROSPER data: /* this section builds info on how to weight dyads for in-group, out-group. */ twostp=((adjmat+adjmat`)>0)*adjmat; /* make it either direction w. the first term */ ttie=adjmat#twostp; /*=1 if tie contributes to a transitive triple */ ttie=((ttie+ttie`)); adjraw=adjmat; adjmat=(adjmat+adjmat`); /* force it to be symetric, 1=asym 2=reciped */ adjmat=adjmat-diag(adjmat); /* remove any self ties */ d2=reachlim((adjmat>0),3); /* re-weight to bias toward recip ties */ wm_4 = (d2=1)#(adjmat=2)#8; /* recip direct ties */ wm_2a = (d2=1)#(adjmat=1)#4; /* unrecip direct ties */ wm_1 = 2*(d2=2);/* ties 2-steps out */ wm_p5 = 0*(d2=3); /* ties 3-steps out - note it's zeroed out here*/ wm=wm_4+wm_2a+wm_1++wm_p5+(3*(ttie/(max(ttie)))); /* transitivity is at the end*/ wm=wm-diag(wm);
Strategies for identifying primary groups: Evade Factor Analysis: Treat the adjacency/similarity matrix as a set of N variables and look for latent factors that explain the variance in the data. Here is code I used in the PROSPER data: /* run factor analysis. Note nfactors is a high value, should only take those w. EV > 2, but this gives us room... */ proc factor rotate=varimax min=&minev out=factset data=symmat nfactors=175 outstat=fscores noprint; run; quit;
Strategies for identifying primary groups: Evade Result:
Strategies for identifying primary groups: Evade Result: Each column is a person, these are the factor loadings for each person on each retained factor.
Strategies for identifying primary groups: Evade Result: Sociogram for a single school
Strategies for identifying primary groups: Evade Result: • Sociogram for a single school. • Problem is that there are no necessary connectivity checks – you can get “groups” that are disconnected. • Biggest strengths are: • Really fast • Allows for overlapping groups • Gives you “embeddedness” scores based on factor loadigs
Strategies for identifying primary groups: Hybrid The Crowds Algorithm 1. Identify members of network bicomponents, remove people not included. 2. Cluster the reduced network. - Identify optimal number of groups: (TREEWALK) - For each level of the cluster partition tree do (BFS): -Move up the tree from smaller to larger groups. -If the fit for both groups is improved by joining them then do so. -If not, then identify group at that level. -End TREEWALK. Do until all groups are identified (GLOBAL LOOP): 3. Evaluate node fit. Do until nodes cannot be moved: For each identified cluster do (GRPCHECK): - Ensure group is a bi-component. -Calculate effect on group a of moving node j to group a. -Calculate effect on j's present group of removing j. - If there is a positive net gain to moving j from own group to a, then do so. End. 4. Identify Bridging members. -If removing j from group a would improve the fit of group a, AND assigning j to any other group would lower the fit for that group, then j is considered a bridge. Place all bridges in separate class. 5. Group Check. Check returns to combining groups. IF merging groups would improve the fit of all groups to be merged, then do so. - Evaluate bridges, to be sure that they are not bridging two groups that have now merged. End Global loop.
Return to first question: What is a group? • The simple notions of a complete clique are difficult to square w. real-world data. • Density is an indicator, but subject to over-grouping (no connectivity) and star-patterns. • Groups are likely internally differentiated – with “core” vs. “periphery” members • Most sociological theories of groups rest on transitive closure and short distances • There’s a sense that members are equal – a tight-knit group • The group should be fairly small – face-to-face scale • The social processes underlying the group turn on reciprocity, trust, communication, homogeneity of norms & beliefs. • Almost all require a comparative set: in-group to out-group. It is relational not essential. • Cross-cutting social circles – would lead us to expect overlapping groups, but in practice most methods do not do that, as it’s analytically too cumbersome. • Practically, group detection is hard and most methods will give you (slightly) different results. You can compare results using a Rand statistic (proportion of pairs similarly categorized in two partitions), but for small settings these differences can matter.
Social Sub-groups: why look? Wayne Baker: The Social Structure of a National Securities Market: 1) Behavioral assumptions of economic actors 2) Micro-structure of networks 3) Macro-structure of networks 4) Price Consequences Under standard economic assumptions, people should act rationally and act only on price. This would result in expansive and homogeneous (I.e. random) networks. It is, in fact, this structure that allows microeconomic theory to predict that prices will settle to an optimal equilibrium
Baker’s Model: He makes two assumptions in contrast to standard economic assumptions: a) that people do not have access to perfect information and b) that some people act opportunistically He then shows how these assumptions change the underlying mechanisms in the market, focusing on price volatility as a marker for uncertainty. The key on the exchange floor is “market makers” people who will keep the process active, keep trading alive, and thus not ‘hoard’ (and lower profits system wide)
Baker’s Model: Micronetworks: Actors should trade extensively and widely. Why might they not? A) Physical factors (noise and distance) B) Avoid risk and build trust • Macro-Networks: Should be undifferentiated. Why not? • A) Large crowds should be more differentiated than small crowds. Why? • Price consequences: Markets should clear. They often don’t. Why? • Network differentiation reduces economic efficiency, leading to less information and more volatile prices
Baker: Use frequency of exchange to identify the network, resulting in: Baker finds that the structure of this network significantly (and differentially) affects the price volatility of the network Groups found w. NEGOPY
The one other program you should know about is NEGOPY. Negopy is a program that combines elements of the density based approach and the graph theoretic approach to find groups and positions. Like CROWDS, NEGOPY assigns people both to groups and to ‘outsider’ or ‘between’ group positions. It also tells you how many groups are in the network. It’s a DOS based program, and a little clunky to use, but NEGWRITE.MOD will translate your data into NEGOPY format if you want to use it. There are many other approaches. If you’re interested in some specifically designed for very large networks (10,000+ nodes), I’ve developed something I call Recursive Neighborhood Means that seems to work fairly well.
Baker: Because size is the primary determinant of clustering in this setting, he concludes that the standard economic assumption of large market = efficient is unwarranted.
Scott Feld: Focal Organization of Social Ties Feld wants to look at the effects of constraint & opportunity for mixing, to situate relational activity within a wider context. The contexts form “Foci”, “A social, psychological, legal or physical entity around which joint activities are organized” (p.1016) People with similar foci will be clustered together. He contrasts this with social balance theory. Claim: that much of the clustering attributed to interpersonal balance processes are really due to focal clustering. (note that this is not theoretically fair critique -- given that balance theory can easily accommodate non-personal balance factors (like smoking or group membership) but is a good empirical critique -- most researchers haven’t properly accounted for foci.)
Observed Clustering within Adolescent Social Networks Network Characteristics of Sub Groups • On average, 65% of a school’s adolescents are in cohesive sub-groups. • 87% of all relations are within sub-groups. • The average sub-group has 22 members. • The average diameter for a sub-group is 3 steps. • The mean segregation index is .96 (1=Complete, 0=Random)
34% 65% 84% 86% 79% 74% Grade College Activities Race GPA Smoking Observed Clustering within Adolescent Social Networks Distribution of Characteristic within groups, relative to school distribution
Group data in Add Health Inter-Group Relations
Group data in Prosper • We have 368 network observations based on 2 cohorts observed over 5 waves in 2 states. Using a variant of the CROWDs algorithm, I identified groups in every network. • Results in about 4500 groups averaging in size of about 10 kids, though some settings are really too cohesive to break into small bits, resulting “peer groups” of 40ish kids. Network Group Characteristics
Group data in Prosper • We have 368 network observations based on 2 cohorts observed over 5 waves in 2 states. Using a variant of the CROWDs algorithm, I identified groups in every network. • Results in about 4500 groups averaging in size of about 10 kids, though some settings are really too cohesive to break into small bits, resulting “peer groups” of 40ish kids.
Group data in Prosper • We have 368 network observations based on 2 cohorts observed over 5 waves in 2 states. Using a variant of the CROWDs algorithm, I identified groups in every network. • Results in about 4500 groups averaging in size of about 10 kids, though some settings are really too cohesive to break into small bits, resulting “peer groups” of 40ish kids.