Download
1 / 24
250 likes | 471 Vues
CAFOs of Missouri A GIS Mapping Project. Elizabeth Schiller. What We’ll Cover. Brief Industry History Swine Industry History Production Process Economic Arguments Data Used Methods & Tools Results Recommendations. Purpose of Project.

E N D
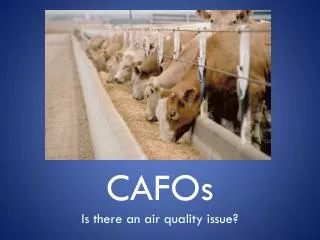
CAFOs of MissouriA GIS Mapping Project Elizabeth Schiller
What We’ll Cover • Brief Industry History • Swine Industry History • Production Process • Economic Arguments • Data Used • Methods & Tools • Results • Recommendations
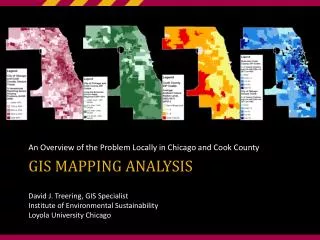
Purpose of Project The purpose of this project is to map the location of Concentrated Animal Feed Operations (CAFOs) in the State of Missouri. In addition, I attempted to correlate water quality violation data using linear regression techniques with the size of the facility, type of livestock, and manure management method.
History of Agriculture • Organized agriculture began over 10,000 years ago • The most important economic activity in the US from the early 1600’s to late 1800’s • By end of WW1, agriculture had settled in regional patterns which allowed producers to maximize production of a particular crop for nearby urban markets. • It was a highly productive, but not profitable industry. • The percentage of the population employed in farming drastically decreased in the 20th century: • 1930 - 25% of the population lived on farms • Late 1980’s - only 2.5% lived on farms • Production levels actually increased during this time due to development of mechanized and animal-driven tools which reduced the need for human input to produce at the same or higher levels
History of Swine Production • Pigs first domesticated in China in 4900 B.C. and in Europe in 1500 B.C. • Brought to America by Hernando de Soto in 1539 • By mid-1800s pigs were being commercially slaughtered • After the Civil War, the invention of the refrigerated rail car allowed pork processing to become more centralized to points of production instead of consumption centers • Hog farmers became concentrated in the “Corn Belt” - Iowa, Illinois, Minnesota, Nebraska, Indiana, and Missouri • Farmers found it more profitable to use corn to feed hogs for market instead of selling directly • 25% return on investment for converting grain to pork vs. 10% return for grains
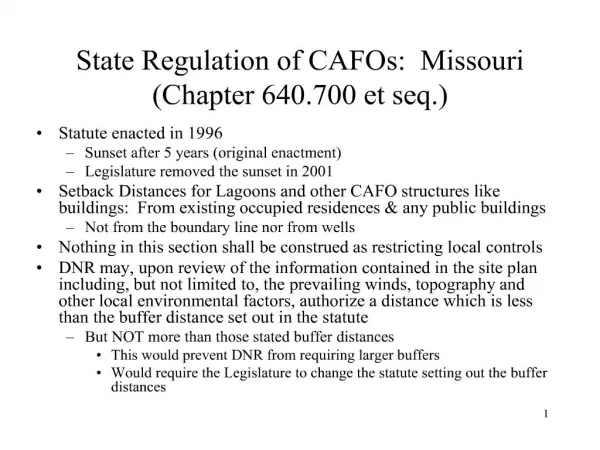
Industrialization of Agriculture • During the 50s & 60s technological advances in genetics, feed, and housing practices allowed farmers to be more efficient in converting feed to pork. • This led to the formation of CAFOs - confined animal feed operations • large scale animal feed operation consisting of a single farm with numerous sows and hogs housed in climate-controlled buildings. Also called factory farms or corporate farms. • North Carolina passed laws to encourage CAFO creation - tax breaks, no regulation, liability exemptions from environmental damage, etc. From 1989 to 1999 hog production increased 500% in NC • Missouri created similar legislation in 1993 and other Midwestern states soon followed • In the past ten years, much consolidation has occurred in hog ownership and slaughterhouse operations. Four companies handle 60% of the market • Latest trend is contract growing - farmer signs a contract with a large corporation to raise hogs from wean to finish in exchange for compensation
Economic Arguments • Major school: Bigger is better • Capitalizes on economies of scale • Emerging thoughts: Bigger is NOT better • Proponents of large scale facilities ignore measurable externalities • Waste Management • Mis-calculation of capital investment costs • Small farms are able to meet or exceed efficiencies of large operations
How are pigs produced for market?Small Farm Farm use acreage to produce cereal grains such as corn, barley, & wheat Create cash inflows for capital investment Produce Manure – used to fertilize acreage • Grains produced are used to: • Feed livestock • Bedding Sows convert feed to marketable hogs
How are pigs produced for market?Large Farm (CAFO) Cereal grains and fabricated feed purchased from out of area suppliers Create cash inflows for capital investment • Grains produced are used to: • Feed livestock Sows convert feed to marketable hogs Produce Manure – stored in waste lagoon
Data Used • Data was acquired from several agencies including: • Missouri Department of Natural Resources (MDNR) • United States Department of Agriculture (USDA) • Environmental Protection Agency (EPA) • University of Missouri Columbia OSEDA project office. • Missouri Spatial Data Information Service • USGS.gov • Data gathered includes: • Complete GIS locator data of all permitted CAFOs in Missouri including latitude, longitude, owner, production, and outfall information. • Relatively complete water quality violation data including size & type of spill, environmental impact reports, and monetary settlements.
Methods & Tools • GIS: • ArcCatalog to organize & import data from other formats • ArcToolbox to import data • ArcMap to create map & layers • Statistics • SPSS • Excel Data Analysis Tools
Statistical Interpretation Ran regression to establish relationship between: Y = monetary penalty amount X1 = Type of animal (hogs, poultry, etc) X2 = Number of gallons spilled X3 = Size of facility
Recommendations • There were no problems obtaining data about CAFO locations. It required a phone call and an e-mailed request. • It was far more difficult to obtain violation data due to the retirement of an employee who had previously tracked this data. After visiting MDNR in person, the data was given to me electronically in a short time.
Conclusions • Spatial Analysis shows relationships between CAFOs and: • State 303d waters • Dog Breeders • Marijuana Production • Relationships need further analysis to clarify • Need better data