Download
1 / 31
310 likes | 650 Vues
A GIS-Based Flood Inundation Mapping and Analysis Pilot Project. Indiana GIS Conference February 19-20, 2008 John Buechler, The Polis Center Moon Kim, USGS-WSC. Presentation Outline . Introduction Pilot Study Overview Near Real Time Analysis Damage Assessment GIS Visualization

E N D
A GIS-Based Flood Inundation Mapping and Analysis Pilot Project Indiana GIS Conference February 19-20, 2008 John Buechler, The Polis Center Moon Kim, USGS-WSC
Presentation Outline • Introduction • Pilot Study Overview • Near Real Time Analysis • Damage Assessment • GIS Visualization • What’s Next
Flood-Inundation Mapping Pilot Project • Generate current and forecast flood-inundation maps: USGS and NWS data • Generate maps for import to HAZUS-MH • Serve maps visually through Web
Collaborative effort • Silver Jackets: A Natural Hazard Mitigation Team • City of Indianapolis • IMAGIS • Indianapolis Museum of ART • INDHS • USACE • IDNR • NWS • USGS • Polis
Observed and Predicted Flood-Inundation Mapping and HAZUS-MH Analysis Using the Ravenswood Area of Indianapolis as a Pilot Study Study Area
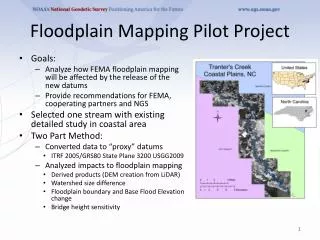
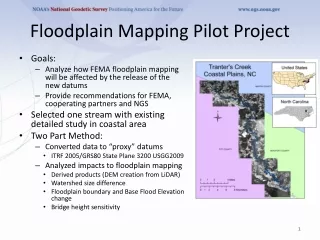
Why Ravenswood? • Ravenswood floods frequently and often damage is incurred • IMA Virginia B. Fairbanks Art and Nature Park in is partially situated in the flood plain: occasional flooding • Availability of high-resolution digital elevation data, detailed building inventory data, USGS/NWS data and extensive historic high-water mark and flood elevation data
Approach • Compile GIS and HAZUS-MH datasets • Calibrate, verify and implement hydraulic model “FastMECH” • Automate data retrieval from USGS/NWS and create input files for FastMECH • Generate a flood grid for a simulated flood and perform a HAZUS-MH analysis • Install, test, and implement web and map servers
Data needs • FastMECH • Observed and predicted stream-flow and water-surface elevation data (USGS, NWS) • High-resolution digital elevation data • HAZUS-MH • Observed and predicted flood-inundation maps from FastMECH • Default hazard, inventory and damage information for level 1 analysis and more detailed local information for the level 2 and 3 analyses
USGS provides real-time river stage and streamflow from streamgages • NWS uses streamgage data and sophisticated computer models to generate forecasts of stage/streamflow
NWS data • Flow and water-surface elevation forecasts are generated by the NWS River Forecast Centers • Forecasts are based on regional rainfall-runoff relations • Automated program will download the forecast data (XML) through the NWS Advanced Hydrologic Prediction Service
FastMECH • Two-dimensional hydraulic flow model • Allows simulation of long reaches • Can handle flow regime changes • Output: Water surface (depths), water velocity, flood arrival times
What is HAZUS-MH? • FEMA created tool that helps communities reduce loss to property and life that may result from natural disasters. • ArcGIS 9.2 extension. Requires installation of Spatial Analyst 9.x (for flood modeling) • Available from FEMA free of charge
Methodology EarthquakeFlood Hurricane
Damage as % of replacement cost 0% 50% 100% 5 ft 10 ft 15 ft 0 ft Depth of water Over 800 curves – and you can create your own as well! Damage Functions • Damage curves are assigned to each building specific occupancy class and each facility Curves vary by hazard. This example represents a flood hazard.
Levels of Analysis Level 3 Input data hazard specific Required User Effort and Sophistication Combinations Level 2 of local and default hazard, building, and damage data Default hazard, inventory, Level 1 and damage information
User Defined Flood Depth Grid HAZUS-MH allows users to point to one or more existing flood depth grids. USGS provided web-based delivery of GIS maps and downloadable flood grids for HAZUS-MH analysis FEMA Presentation – August 2007 20
User Defined Depth Grid • Assign the depth grid, along with • All analysis output options are available.
HAZUS-MH Ravenswood Analysis • USGS provided web-based delivery of GIS maps and downloadable flood grids for HAZUS-MH analysis • HAZUS-MH, a mitigation tool, could then also be used as a response and recovery tool
Products • Web-based near-real-time flood-inundation maps updated hourly. • Web-based forecast maps updated every 6 hrs per NWS • Downloadable flood grids for HAZUS-MH • Results from the HAZUS-MH analysis • USGS Report • Evaluation of models/techniques
Summary • Products will come with disclaimers and error estimates • Highly expandable on a geographic basis • Many possibilities for future enhancements e.g. depth/velocity data for damage estimates • Expands HAZUS-MH from a mitigation-only to a response tool • Web and map server maintenance may be transferred to NWS and/or FEMA
Questions? • Contact Information • John Buechler: jobuechl@iupui.edu • Moon Kim: mkim@usgs.gov