Download
1 / 16
160 likes | 248 Vues
Explore the advantages and challenges of targeting emission line galaxies (ELGs) for redshift measurement, including selection parameters, catalog data, and target bands. Learn about the importance of photometric depth and spectroscopic resolution to efficiently detect ELGs within specific redshift ranges. Discover key findings from studies on ELGs' luminosity functions and redshift distributions for various redshift bins. Gain insights on selecting ELGs based on emission lines like [OII] and optimizing target selection parameters using optical bands.

E N D
Emission Line Galaxy Targeting for BigBOSS Nick Mostek Lawrence Berkeley National Lab BigBOSS Science Meeting Novemenber 19, 2009
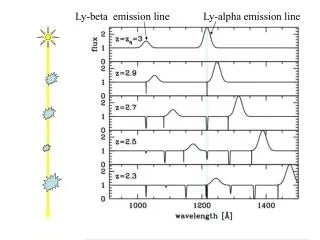
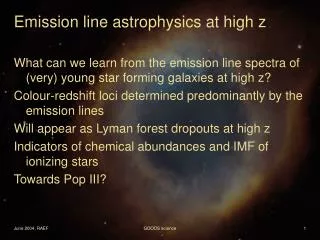
Why Emission Line Galaxies? • Strong emission line spectral features come from excited ISM gases, most commonly found in galaxies with ongoing star formation • Lines fall at specific wavelengths which can be used for accurate redshift measurement • Advantages: • ELGs are numerous in the range of 1<z<2 as they do not require much hierarchical structure formation • Bright, unique identifiers - ideal for measuring redshifts efficiently • Evolution in the [OII] luminosity function is observed up to z=2 due to an increased SFR . (For a fixed volume density, the [OII] luminosity in distant ELGs is higher than rest-frame ELGs) • Disadvantages: • Accurate luminosity functions are difficult to measure beyond z>1.5 • Single emission line detections can be ambiguous • Must have sufficient spectroscopic resolution to achieve z<0.001(1+z) AND efficiently detect the line over background noise
Target Selection Parameters • Photometric depth required to target constant 3.4E-4 (h/Mpc)3 number density • Select brightest [OII] lines ELGs from 0.7<z<2 • High completeness (>70%) for [OII] line flux • Optical photometric selection • 10-15k sq. deg targeting in the Northern Hemisphere within 3 years
COSMOS Mock Catalog Ilbert (2008) Ilbert (2008) • Left panel shows template SEDs fit from 30 band photometry in the zCOSMOS survey field (Ilbert et al., 2008) • Right panel shows the [OII] line fluxes from VVDS spectra and M(UV)-[OII] calibration • LePhare photo-z code used to generate synthetic photometry in ugrizJHK bands
[OII] Luminosity Function Zhu et al., 2008 • Left figure shows the measured luminosity function of DEEP2 [OII]-emitting galaxies for 4 redshift bins. 14,000 [OII] emission line galaxies were used in this sample. • Right figure shows the predicted redshift distribution for a fixed [OII] flux limit from DEEP2 and Ilbert/VVDS. • Stage IV BAO experiments are considering densities in the 10-3 -10-4 (Mpc/h)-3 range
Target Selection Bands Adelberger (2004) • Strong [OII] emission comes from star forming, typically late type galaxies (Sb-Sd and Irregulars) • Adelberger (2004) showed that such galaxies can be selected using optical bands from 1<z<3 • These galaxies typically have relatively flat SEDs except for 2 regions: • Hydrogen Balmer absorption bands, rest frame ~4000 Å. • Ly absorption, rest frame ~912 Å.
z=1.0 z=1.5 grz Selection Adelberger (2004) • Figure at right shows grz color plane with F[OII] >5E-17 cgs for z>0.7 galaxies and a magnitude limit of r <23.5 mag • Selection box is drawn around bulk of bright [OII] emitters at z<1.5 Reddening
ugr Selection Adelberger (2004) • u-band can also provide a redshift color selection, although it works best for z>2 • Synthetic photometry from Ilbert zCOSMOS code shows a selection box is drawn around F[OII] >5E-17 cgs for 1.5<z<2 galaxies and a magnitude limit of r <24 mag Reddening Redshift Reddyr (2006)
Survey Photometric Errors • Looked at the following surveys with available sensitivities, sky brightnesses, and median seeing: • PanStarrs (griz, PS1=360s, 30k deg2) • Palomar Transient Factory (gr, 3 hr, 12k deg2) • Theoretical CFHT survey (u, 400s, 14k deg2) • Errors are statistical. Only systematic considered is a floor on photometric error. Note: PTF errors used here are larger than those quoted by Peter yesterday
Low redshift grz selection • Figure at right shows grz color plane (PTF+PS1) with F[OII] >5E-17 cgs for 0.7<z<2 galaxies and a magnitude limit of r <23.5 mag Note: PTF errors used here are larger than those quoted by Peter yesterday
r magnitude limit for grz cut • For a redshift distribution ~103 galaxies/deg2, we should expect a magnitude limit of ~23.5 and F[OII]~1E-16
ugr Selection Bands • Used gr photometry from PTF and u-band from CFHT, mag limit of r<24 • Marginal u-band data scatters lower redshift objects into selection box…could ugr alone be sufficient? • Selection delivers a mean of 2400 N/(dz.deg2) from 0.8<z<2 • Overall selection of star-forming galaxies with F[OII]>5E-17 cgs is >90%
z=1.0 z=1.5 Life on the Blue Corner • Strong OII line emission and high redshift sample (z>1.5) can be found in the “blue corner” of the grz color plane • Plot on right shows COSMOS objects with magnitude errors from PS1 (grz)
ugr vs. grz blue corner ugr grz • r<24 for both color cuts, no additional color information used for lower redshifts • ugr averages 90% in selection efficiency of bright [OII] for z>1.5, grz averages 85% • For all practical purposes, the cuts are very similar with grz being more effective at weeding out lower redshifts but producing more targets beyond z>2
Summary Proof of Concept Target Selection • ugr produces a ~flat redshift distribution from 1<z<2 at r<24, minimal number density • grz produces a higher density redshift distribution from 0.7<z<1.5 at r<23.5 with a shot at extending to higher redshifts • Limiting [OII] line flux ~1E-16 cgs flux Much to do: • Alternative color selections • Photometric surveys and real errors (PTF, PAN-STARRS) • Observational tests of selection criteria • Color selection optimization