Measuring Fracture Toughness in Engineering Plastics: Insights and Methods
This chapter delves into the various standardized methods for measuring fracture toughness in engineering plastics, as detailed in the book "Polymer Testing". It covers important specimen types including single-edge notched bend (SENB), single-edge notched tension (SENT), and compact tension (CT), providing crucial equations and parameters for assessing material properties. The insights presented by Grellmann and Seidler offer a comprehensive understanding of how fracture toughness impacts the performance and durability of polymer materials in engineering applications.

Measuring Fracture Toughness in Engineering Plastics: Insights and Methods
E N D
Presentation Transcript
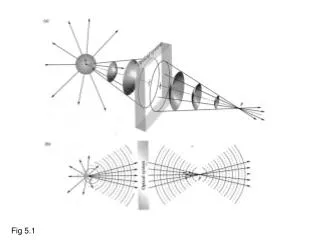
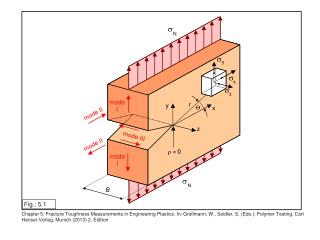
s N s y s x s z mode I r y x mode II z mode III mode II r » 0 mode I s N B Fig.: 5.1 Chapter 5: Fracture Toughness Measurements in Engineering Plastics. In: Grellmann, W., Seidler, S. (Eds.): Polymer Testing. Carl Hanser Verlag, Munich (2013) 2. Edition
SENB specimen (single-edge-notched bend specimen) F W = 10 mm B = 2 … 10 mm L = 80 mm s = 40 … 70 mm a = 0.5 … 7.5 mm N = 2 mm W a F/2 F/2 N s L/2 L/2 a F s K = f I 3/2 W B W 9 7 1 5 3 a a a a a a 2 2 2 2 2 f = 2.9 − 4.6 + 21.8 − 37.6 + 38.7 W W W W W W 2 a a a a 1.99 − 1 − 2.15 − 3.93 + 2.7 W W W a W 3 a f = 3 W 2 W a a 2 1− 1+2 W W Fig.: 5.2a Chapter 5: Fracture Toughness Measurements in Engineering Plastics. In: Grellmann, W., Seidler, S. (Eds.): Polymer Testing. Carl Hanser Verlag, Munich (2013) 2. Edition
SENT specimen (single-edge-notched tension specimen) W = 40 mm H = 150 mm s = 120 mm D = 10 mm a = 18 … 22 mm N = 3 mm B = 2 … 10 mm F W/2 H/2 W s a N H/2 O D 1/2 a F a K = f I W B W F 4 2 3 a a a a a f = 1.99 − 0.41 + 18.7 − 38.48 + 53.85 W W W W W Fig.: 5.2b Chapter 5: Fracture Toughness Measurements in Engineering Plastics. In: Grellmann, W., Seidler, S. (Eds.): Polymer Testing. Carl Hanser Verlag, Munich (2013) 2. Edition
CT specimen (compact tension specimen) F W = 40 mm H = 48 mm G = 50 mm s = 22 mm D = 10 mm a = 18 … 22 mm N = 2 mm B = 2 … 34 mm l = 1.5 mm H/2 l s O D N H/2 a W F G a F K = f I 1/2 W B W 9 1 3 7 5 a a a a a a 2 2 2 2 2 f = 29.6 − 185.5 + 655.7 − 1017 + 638.9 W W W W W W Fig.: 5.2c Chapter 5: Fracture Toughness Measurements in Engineering Plastics. In: Grellmann, W., Seidler, S. (Eds.): Polymer Testing. Carl Hanser Verlag, Munich (2013) 2. Edition
b 260 K a 240 c 1/2 240 K Ic 210 220 K ; K (MPamm ) 180 SENT 1/2 200 Ic 150 B EDZ min c K ; K (MPamm ) 180 120 B ESZ/EDZ Ic 160 90 10 20 30 0 c K c B (mm) 140 60 K Ic 120 B CT min 100 0 2 4 6 8 1 0 B (mm) B ( m m ) Fig.: 5.3
a residual fracture area b damage area stable crack growth (fracture mirror length) machined notch (razor blade notch) 100 µm B Fig.: 5.4 Chapter 5: Fracture Toughness Measurements in Engineering Plastics. In: Grellmann, W., Seidler, S. (Eds.): Polymer Testing. Carl Hanser Verlag, Munich (2013) 2. Edition
s y s y d x r a pl s Fig.: 5.5 Chapter 5: Fracture Toughness Measurements in Engineering Plastics. In: Grellmann, W., Seidler, S. (Eds.): Polymer Testing. Carl Hanser Verlag, Munich (2013) 2. Edition
a b 200 µm 50 µm Fig.: 5.6 Chapter 5: Fracture Toughness Measurements in Engineering Plastics. In: Grellmann, W., Seidler, S. (Eds.): Polymer Testing. Carl Hanser Verlag, Munich (2013) 2. Edition
s/2 d/2 2 3 (W a) W 1 1 n max f 1 hinge point 2 sharp notch 3 support Fig.: 5.7 Chapter 5: Fracture Toughness Measurements in Engineering Plastics. In: Grellmann, W., Seidler, S. (Eds.): Polymer Testing. Carl Hanser Verlag, Munich (2013) 2. Edition
y 2 s/2 1 d SZH d/2 x SZH 3 100 µm SZW a stable crack growth 5 µm b stretch zone brittle fracture initial crack SZW 10 µm SZH c d Fig.: 5.8 Chapter 5: Fracture Toughness Measurements in Engineering Plastics. In: Grellmann, W., Seidler, S. (Eds.): Polymer Testing. Carl Hanser Verlag, Munich (2013) 2. Edition
T y n a b I dR 1 a 1 I 2 a F 2 I Riss 3 a crack 3 x 1 2 A R G f (i=1...3) i f resp. v c d J Ic I I I 1 2 3 J A I G B f 3 a ¶A f 1 1 G 2 f ¶a B a a 1 3 2 a f resp. v Fig.: 5.9 Chapter 5: Fracture Toughness Measurements in Engineering Plastics. In: Grellmann, W., Seidler, S. (Eds.): Polymer Testing. Carl Hanser Verlag, Munich (2013) 2. Edition
loading parameter blunting Line J; d technical crack initiation J ; d 0.2 0.2 resistance against crack propagation crack propagation physical crack initiation resistance against crack initiation crack initiation J ; d i i crack blunting Da Da = 0.2 mm SZW stable crack growth Da Fig.: 5.10 Chapter 5: Fracture Toughness Measurements in Engineering Plastics. In: Grellmann, W., Seidler, S. (Eds.): Polymer Testing. Carl Hanser Verlag, Munich (2013) 2. Edition
junction diode laser collecting lens F deflection mirror CT specimen start v F semiconductor prism motor t stop evaluation and graphics rotating mirror Fig.: 5.11 Chapter 5: Fracture Toughness Measurements in Engineering Plastics. In: Grellmann, W., Seidler, S. (Eds.): Polymer Testing. Carl Hanser Verlag, Munich (2013) 2. Edition
type II type I 5 % 5 % F max T T F max F F Q Q F F S S a v v c c v; v ; f v; v ; f L L Fig.: 5.12 Chapter 5: Fracture Toughness Measurements in Engineering Plastics. In: Grellmann, W., Seidler, S. (Eds.): Polymer Testing. Carl Hanser Verlag, Munich (2013) 2. Edition
crack initiation crack propagation 5 4 b c crack blunting 3 200 µm 1 mm 2 a 1 50 µm 0 0 1 2 3 4 5 -2 F/(B(W−a )) (Nmm ) f (mm) eff Fig.: 5.13 Chapter 5: Fracture Toughness Measurements in Engineering Plastics. In: Grellmann, W., Seidler, S. (Eds.): Polymer Testing. Carl Hanser Verlag, Munich (2013) 2. Edition
unnotched specimen notched specimen F F max max F (N) F (N) A A G 0 v ; f v ; f 0 L0 max Lmax v ; f (mm) v ; f (mm) L L Fig.: 5.14 Chapter 5: Fracture Toughness Measurements in Engineering Plastics. In: Grellmann, W., Seidler, S. (Eds.): Polymer Testing. Carl Hanser Verlag, Munich (2013) 2. Edition
load–deflection diagram Charpy impact tester ICIT-4J AG = Apl + Ael Fmax striker load (F) - transducer Fgy load F (N) t specimen F1 Apl AR personal computer tB ; fmax fgy time resp. deflection (ms; mm) analysis of F–f diagram amplifier digital oscilloscope - checking of experimental conditions tB > 3t F1 < Fmax AH > 3 AG - SEM analysis of fracture surface - fracture mechanics concept support - checking of geometry - independence of fracture mechanics values photooptical transducer deflection (f) - sensor KId ; dId ; JId Fig.: 5.15 Chapter 5: Fracture Toughness Measurements in Engineering Plastics. In: Grellmann, W., Seidler, S. (Eds.): Polymer Testing. Carl Hanser Verlag, Munich (2013) 2. Edition
Fmax II I III Fmax Fmax Fgy FF AG = Apl + Ael Fgy Apl F AG Ael AG fgy fmax fmax fmax fgy Fmax Ia IIa IIIa Fmax Fmax Fgy FF Fgy Apl AR AG AR AG Ael AR fmax fmax fmax fgy fgy f Fig.: 5.16 Chapter 5: Fracture Toughness Measurements in Engineering Plastics. In: Grellmann, W., Seidler, S. (Eds.): Polymer Testing. Carl Hanser Verlag, Munich (2013) 2. Edition
a/W = 0.45 a/W = 0.2 F = 53 N max -1 F = 36 N F = 36 N 1 1 F = 28 N v = 2.9 ms max I F = 62 N max -1 F = 36 N max v = 1 ms I F = 8 N F = 8 N 1 1 Fig.: 5.17 Chapter 5: Fracture Toughness Measurements in Engineering Plastics. In: Grellmann, W., Seidler, S. (Eds.): Polymer Testing. Carl Hanser Verlag, Munich (2013) 2. Edition
F A W a s L B B B 0.05 < a/W < 0.15 0.1 < a/W < 0.4 0.3 < a/W < 0.7 Fig.: 5.18 Chapter 5: Fracture Toughness Measurements in Engineering Plastics. In: Grellmann, W., Seidler, S. (Eds.): Polymer Testing. Carl Hanser Verlag, Munich (2013) 2. Edition
3.0 PVCC BL J 2.5 -1 FEM J v = 1.5 ms I s/W = 4 RT 2.0 J-integral ratio MC J 1.5 FEM J 1.0 ST J FEM J 0.5 RPM J FEM J 0 0 0.2 0.4 0.6 0.8 Fig.: 5.19 a/W Chapter 5: Fracture Toughness Measurements in Engineering Plastics. In: Grellmann, W., Seidler, S. (Eds.): Polymer Testing. Carl Hanser Verlag, Munich (2013) 2. Edition
100 -1.73 b = 3466 K I 10 b 1 0.1 100 1000 10 1/2 K ; K (MPamm ) Id Ic Fig.: 5.20 Chapter 5: Fracture Toughness Measurements in Engineering Plastics. In: Grellmann, W., Seidler, S. (Eds.): Polymer Testing. Carl Hanser Verlag, Munich (2013) 2. Edition
10000 -0.94 e = 224 J I 1000 e 100 10 1 1 10 100 0.1 -1 J ; J (Nmm ) Id Ic Fig.: 5.21 Chapter 5: Fracture Toughness Measurements in Engineering Plastics. In: Grellmann, W., Seidler, S. (Eds.): Polymer Testing. Carl Hanser Verlag, Munich (2013) 2. Edition
100 -0.83 = 3.6 d Idk 10 0.1 1 0.01 d [mm] Idk Fig.: 5.22 Chapter 5: Fracture Toughness Measurements in Engineering Plastics. In: Grellmann, W., Seidler, S. (Eds.): Polymer Testing. Carl Hanser Verlag, Munich (2013) 2. Edition
spring F acceleration unit drop weigth strain gauge lifting device clamped test sheet cross-head masses controller instrumented drop weigth support temperature chamber Fig.: 5.23 Chapter 5: Fracture Toughness Measurements in Engineering Plastics. In: Grellmann, W., Seidler, S. (Eds.): Polymer Testing. Carl Hanser Verlag, Munich (2013) 2. Edition
PA 6 + impact modifier 25 0 wt.-% 5 wt.-% 10 wt.-% 20 wt.-% 25 wt.-% 20 15 10 5 0 70 90 10 30 -30 50 -70 -50 -10 T (°C) ST J (Nmm-1) d Fig.: 5.24 Chapter 5: Fracture Toughness Measurements in Engineering Plastics. In: Grellmann, W., Seidler, S. (Eds.): Polymer Testing. Carl Hanser Verlag, Munich (2013) 2. Edition
7 6 5 4 PVC/chalk 3 PP/chalk PVC/SiO 2 2 PE/SiO 2 PE/BW 1 PE/HP 0 0.3 0.1 0.2 0.4 0 j v ST J (Nmm-1) d Fig.: 5.25 Chapter 5: Fracture Toughness Measurements in Engineering Plastics. In: Grellmann, W., Seidler, S. (Eds.): Polymer Testing. Carl Hanser Verlag, Munich (2013) 2. Edition
a b 2.0 500 1.8 450 1.6 400 1.4 350 1.2 300 f (mm) F (N) max 1.0 PVC/chalk max 250 PP/chalk 0.8 200 PVC/SiO 2 0.6 PE/SiO 2 150 PE/BW 0.4 PE/HP 100 0.2 0.3 0.3 0.1 0.1 0.2 0.2 0.4 0.4 0 0 50 j j 0 v v Fig.: 5.26 Chapter 5: Fracture Toughness Measurements in Engineering Plastics. In: Grellmann, W., Seidler, S. (Eds.): Polymer Testing. Carl Hanser Verlag, Munich (2013) 2. Edition
1.6 stearic acid surfactant 1.4 = 0.9 = 1.5 a b 1.2 1.0 5 µm 2 µm 0.8 0 0.25 0.50 0.75 1.00 1.25 1.50 coupling agent content (wt.-%) M ST J /J Id Fig.: 5.27 Chapter 5: Fracture Toughness Measurements in Engineering Plastics. In: Grellmann, W., Seidler, S. (Eds.): Polymer Testing. Carl Hanser Verlag, Munich (2013) 2. Edition
110 PVC P V C 100 j PVC + chalk (j = 0.17) P V C + K r e i d e ( = 0 , 1 7 ) v v 90 d (10-3 mm) 80 Id 70 60 50 40 30 20 -150 -100 -50 0 50 1 2 3 1 7 3 2 2 3 2 7 3 3 2 3 T (°C) T ( K ) Fig.: 5.28 Chapter 5: Fracture Toughness Measurements in Engineering Plastics. In: Grellmann, W., Seidler, S. (Eds.): Polymer Testing. Carl Hanser Verlag, Munich (2013) 2. Edition
b a 450 0.45 400 0.40 350 f (mm) F (N) max max 300 0.35 250 0.30 200 0 0.1 0.2 0.3 0 0.1 0.2 0.3 j j v v 5 c d 210 K (a ) ld eff 4 180 1/2 -1 150 J (Nmm ) K (MPamm ) 3 K (a ) ld 0 Id 120 Id 2 90 1 60 0 0.1 0.2 0.3 0 0.1 0.2 0.3 j j Fig.: 5.29 v v Chapter 5: Fracture Toughness Measurements in Engineering Plastics. In: Grellmann, W., Seidler, S. (Eds.): Polymer Testing. Carl Hanser Verlag, Munich (2013) 2. Edition
2.5 2.0 PP/GF 1.5 Id M PE/GF J /J Id 1.0 0.5 ; experiment model 0 0 0.3 0.1 0.2 j v Fig.: 5.30 Chapter 5: Fracture Toughness Measurements in Engineering Plastics. In: Grellmann, W., Seidler, S. (Eds.): Polymer Testing. Carl Hanser Verlag, Munich (2013) 2. Edition
F F G G 100 N M 100 N f A /A f A /A R 1.2 R M 0.8 mm 0.8 mm 1.0 100 µm 0.8 PP + glass-fiber 0.6 (j = 0.13) v 0.4 100 µm 0 0.25 0.50 0.75 1.00 coupling agent content (wt.-%) Fig.: 5.31 Chapter 5: Fracture Toughness Measurements in Engineering Plastics. In: Grellmann, W., Seidler, S. (Eds.): Polymer Testing. Carl Hanser Verlag, Munich (2013) 2. Edition
4 E/P copolymer + 10 wt.-% GF with 0.4 wt.-% CA 3 J (Nmm-1) 2 without CA 1 0 0.2 0.6 0.4 0 0.8 Da (mm) CA – coupling agent content Fig.: 5.32 Chapter 5: Fracture Toughness Measurements in Engineering Plastics. In: Grellmann, W., Seidler, S. (Eds.): Polymer Testing. Carl Hanser Verlag, Munich (2013) 2. Edition
; experiment ; model 100 80 with coupling agent -2 60 a (kJm ) cN without coupling agent 40 20 0 80 100 0 20 40 60 PE content (wt.-%) Fig.: 5.33 Chapter 5: Fracture Toughness Measurements in Engineering Plastics. In: Grellmann, W., Seidler, S. (Eds.): Polymer Testing. Carl Hanser Verlag, Munich (2013) 2. Edition
TPU/ABS blends Da Da 9 min max TPU/ABS 50/50 7 TPU/ABS 20/80 -1 J (Nmm ) 5 ABS 3 1 0 0.4 0.2 0.6 0.8 Da (mm) Fig.: 5.34 Chapter 5: Fracture Toughness Measurements in Engineering Plastics. In: Grellmann, W., Seidler, S. (Eds.): Polymer Testing. Carl Hanser Verlag, Munich (2013) 2. Edition
4 -1 3 T = 30 °C A 1.4 µm J (Nmm ) c 16 0.2 A = 2.00 µm 2 A = 1.45 µm A = 1.40 µm 12 1 A = 1.30 µm 2.0 1.0 1.5 A = 1.20 µm Da A (µm) min -1 J (Nmm ) 8 4 Da max 0 0.8 0.2 0.4 0.6 0 Da (mm) Fig.: 5.35 Chapter 5: Fracture Toughness Measurements in Engineering Plastics. In: Grellmann, W., Seidler, S. (Eds.): Polymer Testing. Carl Hanser Verlag, Munich (2013) 2. Edition
10 8 -1 A 0.4 µm 6 J (Nmm ) c T = 23 °C 4 30 0.2 2 Da max 0 0.6 0.9 1.2 0.3 A (µm) 20 A = 1.00 µm A = 0.57 µm -1 A = 0.54 µm J (Nmm ) A = 0.40 µm Da min A = 0.39 µm A = 0.36 µm 10 0 0.8 0.6 0 0.2 0.4 Da (mm) Fig.: 5.36 Chapter 5: Fracture Toughness Measurements in Engineering Plastics. In: Grellmann, W., Seidler, S. (Eds.): Polymer Testing. Carl Hanser Verlag, Munich (2013) 2. Edition
copolymer 1 (30 °C) 8 copolymer 2 (20 °C) -1 6 J (Nmm ) 7 4 0.2 2 6 0 3 1 2 4 0 5 A/D 4 brittle copolymer 1 3 tough 2 copolymer 2 1 high impact 0 20 -30 10 -20 -10 40 0 30 50 T (°C) (A/D) c Fig.: 5.37 Chapter 5: Fracture Toughness Measurements in Engineering Plastics. In: Grellmann, W., Seidler, S. (Eds.): Polymer Testing. Carl Hanser Verlag, Munich (2013) 2. Edition
energy - determined 100 80 high impact 60 j (wt.-%) tough EPR 40 20 brittle 0 -80 -60 0 -40 20 -20 40 T (°C) ST J J Id 0.2 Fig.: 5.38 Chapter 5: Fracture Toughness Measurements in Engineering Plastics. In: Grellmann, W., Seidler, S. (Eds.): Polymer Testing. Carl Hanser Verlag, Munich (2013) 2. Edition
175 composition 1 150 1/2 K (MPamm ) 125 Id 100 composition 2 75 0 10 30 20 40 50 t (min) w Fig.: 5.39 Chapter 5: Fracture Toughness Measurements in Engineering Plastics. In: Grellmann, W., Seidler, S. (Eds.): Polymer Testing. Carl Hanser Verlag, Munich (2013) 2. Edition
2 µm Fig.: 5.40 Chapter 5: Fracture Toughness Measurements in Engineering Plastics. In: Grellmann, W., Seidler, S. (Eds.): Polymer Testing. Carl Hanser Verlag, Munich (2013) 2. Edition
carbon black content (phr) 0 10 20 30 40 50 60 J (Nmm-1) d 200 carbon black 150 sulfur 100 50 0 1.0 1.5 2.0 2.5 sulfur content (phr) Fig.: 5.41 Chapter 5: Fracture Toughness Measurements in Engineering Plastics. In: Grellmann, W., Seidler, S. (Eds.): Polymer Testing. Carl Hanser Verlag, Munich (2013) 2. Edition
material selection dimensioning fracture behavior strength verification strain verification e >e e < e s <s s >s brittle tough undefined zul zul zul zul Charpy impact strength unsufficient sufficient demands on technology velocity- manufacturing monitoring temperature- realizable unrealizable shifting-concept unsufficient sufficient fracture mechanics concept realization K < K K > K I I zul I I zul or J > J J < J I I zul I I zul Fig.: 5.42 Chapter 5: Fracture Toughness Measurements in Engineering Plastics. In: Grellmann, W., Seidler, S. (Eds.): Polymer Testing. Carl Hanser Verlag, Munich (2013) 2. Edition