Download
1 / 52
540 likes | 814 Vues
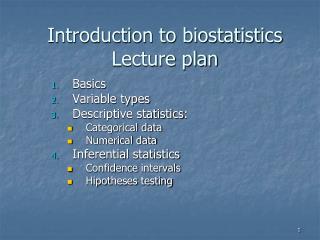
Introduction to biostatistics Lecture plan. Basics Variable types Descriptive statistics : Categorical data Numerical data I nferential statistics Confidence interval s Hipot heses testing. DEFINITIONS.

E N D
Introduction to biostatisticsLecture plan Basics Variable types Descriptive statistics: Categorical data Numerical data Inferential statistics Confidence intervals Hipotheses testing
DEFINITIONS STATISTICS can mean 2 things:- the numbers we get when we measure and count things (data) - a collection of procedures for describing and anlysing data. BIOSTATISTICS – application of statistics in nature sciences, when biomedical and problems are analysed.
Why do we need statistics? • ????
Basic parts of statistics: • Descriptive • Inferential
Terminology • Population • Sample • Variables
Variable types • Categorical (qualitative) • Numerical (quantitative) • Combined
Categorical data Nominal • 2 categories • >2 categories Ordinal
Numerical data • Continuous • Discrete
Description of categorical data • Arranging data • Frequencies, tables • Visualization (graphical presentation)
Frequencies and contingency tables From those who were unsatisfied 4 were males, 6 were females.
Graphical presentation • Other: - Maps - Chernoff faces - Star plots, etc.
Description of numerical data • Arranging data • Frequencies (relative and cumulative), graphical presentation • Measures of central tendency and variance • Assessing normality
Grouping • Sorting data • Groups (5-17 gr.) according researcher’s criteria. To assess distribution, for graphical presentation in excel
Frequencies, their comparison and calculation 197 students were asked about the amount of money (litas) they had in cash at the moment.
Normal distributions • Most of them around center • Less above and lower central values, approximately the same proportions • Most often Gaussian distribution
Not normal distributions • More observations in one part.
How would you describe/present your respondents if the data are numeric? 2 groups of measures: • Central tendency (central value, average) • Variance
MEASURES OF CENTRAL TENDENCY • Means/averages (arithmetic, geometric, harmonic, etc.) • Mode • Median • Quartiles
MEASURES OF CENTRAL TENDENCY • Arithmetic mean (X, μ)
MEASURES OF CENTRAL TENDENCY Median (Me) – the middle value or 50th procentile (the value of the observation, that divides the sorted datain almost equal parts). It is found this way • When n odd: median is the middle observation • When n even: median is the average of values of two middle observations
MEASURES OF CENTRAL TENDENCY • Mode (Mo) – the most common values • Can be more than one mode
MEASURES OF CENTRAL TENDENCY • Quartiles (Q1, Q2, Q3, Q4) – sample size is divided into 4 equal parts getting 25% of observations in each of them.
Is it enough measure of central tendency to describe respondents?
MEASURES OF VARIANCE • Min and max • Range • Standard deviation – sqrt of variance (SD) • Variance - V= ∑(xi - x)2/n-1 • Interquartile range (Q3-Q1 or 75%-25%) IQRT
What measures are to be used for sample description? If distribution is NORMAL • Mean • Variance (orstandard deviation) If distribution is NOT NORMAL • Median • IQRT or min/max Those measures are used also with numeric ordinal data
X, Mo, Me • Mean~Median~Mode, • SD ir empyric rule
EMPYRICAL RULE Number of observations (%) 1, 2 ir 2.5 SD from mean if distribution is normal
Example X=8 SD=2,5 +2SD -2SD X
Normality assessmentSummary • Graphical • Comparison of measures of central tendency; empyrical rule (mean and standard deviation) • Skewness and kurtosis(if Gaussian =0) • Kolmogorov-Smirnov test
Boxplot 75th Procentile 75th Procentile Mean( *) Median 25th Procentile 25th Procentile Outliers
Inferential statistics • Confidence intervals • Hipothesestesting
Confidence intervals Interval where the “true” value most likely could occur.
The variance of samples and their measures X3, SD3; p3 X2, SD2; p2 X1, SD1; p1 X4; SD4; p4 X μ, σ, p0
Confidence interval • Statistical definition: If the study was carried out 100 times, 100 results ir 100 CI were got, 95times of 100the “true” value will be in that interval. But it will not appear in that interval 5 times of 100.
Confidence intervals(general, most common calculation) 95% CI : X ± 1.96 SE Xmin; Xmax Note: for normal distribution, when n is large 95% CI :p± 1.96 SE pmin; pmax Note: when p ir 1-p > 5/n
Width of confidence inerval depends on: • Sample size; • Confidence level (guaranty - usually 95%, but available any %); • dispersion.
Hipotheses testing H0: μ1=μ2; p1=p2; (RR=1, OR=1, difference=0) HA: μ1≠μ2; p1≠p2 (two sided, one sided)
Hipotheses testing Significance level α (agreed 0.05). Test for P value (t-test, χ2, etc.). P value is the probability to get the difference (association), if the null hypothesis is true. ORP value is the probability to get the difference (association) due to chance alone, when the null hypothesis is true.
Statistical agreements • If P<0.05, we say, that results can’t be explained by chance alone, therefore we reject H0and accept HA. • If P≥0.05, we say, that found difference can be due to chance alone, therefore we don’t reject H0.
Tests Test depends on • Study design, • Variable type • distribution, • Number of groups, etc. • Tests(probability distributions): • z test • t test (one sample, two independent, paired) • Χ2 (+ trend) • F test • Fisher exact test • Mann-Whitney • Wilcoxon and others.