Introduction to Biostatistics: Understanding Statistics for Data Analysis
500 likes | 2.89k Vues
Learn about the basics of statistics through biostatistics, including descriptive and inferential statistics, data analysis techniques, and principles for making informed conclusions. Explore measures of central tendency and dispersion, EDA, and hypothesis testing.

Introduction to Biostatistics: Understanding Statistics for Data Analysis
E N D
Presentation Transcript
Introduction to Biostatistics Nguyen Quang Vinh – Goto Aya
What & Why is Statistics?+ Statistics, Modern society+ Objectives → Statistics Applying for Data analysis+ Correct scene - Dummy tables+ Right tests
Statistics • Statistics: - science of data • - study of uncertainty • Biostatistics: data from: Medicine, Biological sciences (business, education, psychology, agriculture, economics...) • Modernsociety: • - Reading, Writing & • - Statisticalthinking: to make the strongest possible conclusions from limited amounts of data.
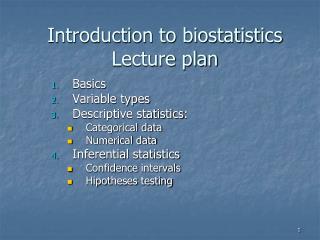
Objectives (1) Organize & summarizedata (2) Reachinferences (sample population) Statistics: Descriptivestatistics (1) Inferentialstatistics (2)
Descriptivestatistics Grouped data the frequency distribution Measures of central tendency Measures of dispersion (dispersion, variation, spread, scatter) Measures of position Exploratory data analysis (EDA) Measures of shape of distribution: graphs, skewness, kurtosis
Inferentialstatisticsdrawing of inferences • Estimation • Hypothesis testing reaching a decision +Parametric statistics + Non-parametric statistics << Distribution-free statistics • Modeling, Predicting
Descriptivestatistics GROUPED DATA THE FREQUENCY DISTRIBUTION Tables
DescriptivestatisticsMEASURES OF CENTRAL TENDENCY The Mean (arithmetic mean) The Median (Md) The Midrange (Mr) Mode (Mo)
DescriptivestatisticsMEASURES OF DISPERSION(dispersion, variation, spread, scatter) Range Variance Standard Deviation Coefficient of Variance
DescriptivestatisticsExploratory data analysis (EDA) Stem & Leaf displays Box-and-Whisker Plots (min, Q1, Q2, Q3, max)
DescriptivestatisticsMEASURES OF SHAPE OF DISTRIBUTIONGraphs Frequencydistribution Relative frequency of occurrence proportion of values Nominal, Ordinal level Bar chart Pie chart • Interval, Ratio level • The histogram: frequency histogram & relative frequency histogram • Frequencypolygon: midpoint of class interval • Pareto chart: bar chart with descending sorted frequency • Cumulativefrequency • Cumulativerelativefrequency → OGIVE graph (Ojiv or Oh’-jive graph)
DescriptivestatisticsMEASURES OF SHAPE OF DISTRIBUTIONSkewness, Kurtosis Skewness (Sk), Pearsoniancoefficient, is a measure of asymmetry of a distribution around its mean. Kurtosis characterizes the relative peakedness or flatness of a distribution compared with the normal distribution.
InferentialstatisticsHypothesis testing reaching a decision
Whatstatisticalcalculationscannot do • Choosinggoodsample • Choosinggoodvariables • Measuringvariablesprecisely
Goals for physicians • Understand the statistics portions of most articles in medical journals. • Avoid being bamboozled by statistical nonsense. • Do simple statistics calculations yourself. • Use a simple statistics computer program to analyze data. • Beabletorefer to a more advanced statistics text or communicate with a statistical consultant (without an interpreter).
Two problems: Important differences are oftenobscured (biological variability and/or experimental imprecision) Overgeneralize
How to overcome • Scientific & Clinical Judgment • Common sense • Leap of faith
Statistics encourage investigators to become thoughtful& independentproblemsolvers
Applying for Data analysis Very important! Have the authors set the scene correctly?→Dummytables
Example • 113 newborns, Male:Female = 50:63, were weighted (grams) as follow: Male: 3500, 3700, 3400, 3400, 3400, 3100, 4100, 3600, 3600, 3400, 3800, 3100, 2400, 2800, 2600, 2100, 1800, 2700, 2400, 2400, 2200, 2600, 4600, 4400, 4400, 2100, 4300, 3000, 3300, 3100, 3400, 3300, 4100, 2300, 3000, 4400, 3100, 2900, 2400, 3500, 3400, 3400, 3100, 3600, 3400, 3100, 2800, 2800, 2600, 2100. Female: 3900, 2800, 3300, 3000, 3200, 3600, 3400, 3300, 3300, 3300, 4200, 4500, 4200, 4100, 2400, 3100, 3500, 3100, 2800, 3500, 3800, 2300, 3200, 2300, 2400, 2200, 4400, 4100, 3700, 4400, 3900, 4100, 4300, 4100, 2900, 2500, 2200, 2400, 2300, 2500, 2200, 4100, 3700, 4000, 4000, 3800, 3800, 3300, 3000, 2900, 2000, 2800, 2300, 2400, 2100, 3700, 3400, 3900, 4100, 3600, 3800, 2400, 1800.
Questions • % of F ≠ 50% • Mean of weights ≠ 3000g
Descriptive statistics n= 113 Gender: Female (n,%) 63 (0.56%)
Descriptive statistics • n= 113 • Weight: Mean: 3217.7g (S.D.= 0.499g) Median: 3300g (Min: 1800g, Max: 4600g)
Analytic statisticsBinomial test • Test of p = 0.5 vs. p not = 0.5 • The results indicate that there is no statistically significant difference (p = 0.259). • In other words, the proportion of females in this sample does notsignificantlydiffer from the hypothesized value of 50%.
Analytic statisticsOne sample t-test • Test of μ = 3000 vs. not = 3000 • The mean of the variable weight3217.70g, which is statistically significantly different from the test value of 3000g. • Conclusion: this group of newborns has a significantly higher weight mean.
References • Intuitive Biostatistics. Harvey Motulsky. Oxford University Press, 2010. • Business Statistics Textbook. Alan H. Kvanli, Robert J. Pavur, C. Stephen Guynes. University of North Texas, 2000. • Biostatistics: A Foundation for Analysis in the Health Sciences. Wayne W. Daniel. Georgia State University, 1991.