Download

1 / 22
220 likes | 317 Vues
Learn about economic growth theories, such as the Solow-Swan model, labor productivity, and the golden rule of growth. Explore how factors like savings, population growth, and capital stock influence countries' growth trajectories.

E N D
Economic Growth Professor Chris Adam Australian Graduate School of Management University of Sydney and University of New South Wales
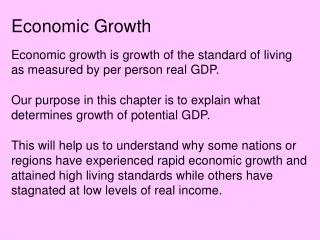
INTRODUCTION • Observe rising incomes and standards of living • Know that level of GDP driven by • Capital • Labour • Technology • Changes in GDP must come from changes in factors
GROWTH MODEL • Solow-Swan growth model (1956) • “Dynamic capital accumulation” • Can explain how growth occurs • Can explain differences in growth • Key elements are savings and population growth • Technological progress also important but not covered here
GROWTH MODEL • Supply of goods and production Y = F(K, L) • Constant returns to scale • Analyze all quantities relative to labour force: Y/L = F(K/L, 1) or y = f(k)
GROWTH MODEL • Supply of goods and production • Slope of function is marginal productivity of capital per worker • Slope declines with increased capital per worker
GROWTH MODEL • Demand for goods and consumption • Output per worker divided between consumption goods and investment goods y = c + i • Omits government and international sectors
GROWTH MODEL • Demand for goods and consumption • Savings is fraction 0 < s < 1 of income, so consumption is c = (1 – s)y • Implies investment equals saving: i = sy
USING GROWTH MODEL • Capital stock growth and steady state • Investment (i) increases capital stock = savings (sf(k)) increases capital stock • Depreciation reduces capital stock: depreciation rate = d • Change in capital stock Dk then Dk = i – dk
USING GROWTH MODEL • Capital stock growth and steady state • Steady state when Dk = 0 • implying i = sf(k*) = dk* for k* steady state (constant) capital per worker
USING GROWTH MODEL • How savings affects growth • Increased savings rate (s) means less consumption per worker and more investment • Leads to higher level of capital stock per worker (k) • Strong empirical support
USING GROWTH MODEL • What determines savings rates? • Similar investment rates do not always produce same income per worker – what else matters?
GOLDEN RULE OF GROWTH • Is more savings always good? • Gives larger capital stock per worker and higher output per worker • But reduces consumption per worker • Want to compare steady states to see which has highest consumption per worker
GOLDEN RULE OF GROWTH • Consider level of consumption at steady state c* = f(k*) – dk* Consumption is what is left of steady state output after allowing for steady state depreciation • Set level of savings to ensure c* is maximized: this is Golden Rule Savings • occurs when marginal product of k equals d
TRANSITION TO GOLDEN RULE • Too much capital per worker: • Policy maker lowers saving rate to Golden Rule level • Increases consumption and reduces investment • Investment rate now below depreciation rate • Reduces output, investment further • Consumption decreases from peak, but will remain above original level since at Golden Rule
TRANSITION TO GOLDEN RULE • Too little capital per worker: • Policy maker increases saving rate to Golden Rule level • Reduces consumption and increases investment • Investment rate now above depreciation rate • Increases output, investment further • Consumption increases from dip, and will remain above original level since at Golden Rule
POPULATION GROWTH • Growth in population increases workforce • Dilutes capital and output per worker at steady state • Population growth rate (n) reduces capital stock per worker in same way as depreciation Dk = i – (d + n)k = sf(k) – (d + n)k • Steady state k* from Dk = 0 = sf(k*) – (d + n)k*
POPULATION GROWTH • Growth in population has three effects on growth: • Better view of sustained growth drivers: total output grows • Better view of national income differences: higher population grow lowers GDP per person • Golden Rule adjusted: now marginal product of capital per worker to equal (d + n)
TAKEAWAYS • Solow-Swan model shows • How saving sets steady state capital stock per worker and steady state income per worker • How population growth sets steady state capital stock per worker and steady state income per worker • What policy makers might do to maximize consumption per worker in steady state