Download
1 / 30
300 likes | 472 Vues
EAEE E4001. Industrial Ecology of Earth Resources. Measures of environmental performance. Broad “stages” of industrial activities: Extraction of materials : mining, oil drilling, agriculture, forestry, fishery…

E N D
EAEE E4001 Industrial Ecology of Earth Resources Measures of environmental performance
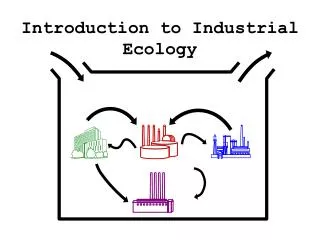
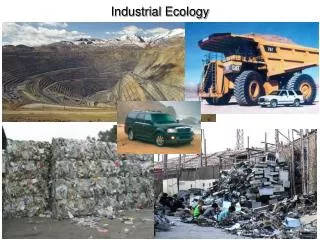
Broad “stages” of industrial activities: • Extraction of materials: mining, oil drilling, agriculture, forestry, fishery… • Processing of primary materials: cement and metal production, oil refining, food and wood processing… • Primary fabricating: tube and wire, plastics, paper construction… • Manufacturing: motors, cars, plastic and paper cups… • Use of materials and products by public • Recycling or disposal of used materials
“Classes of environmental concerns” regarding the potential impacts of each class of activities: • ¨Human health: carcinogenic, respiratory, eye/ear, esthetic… • ¨Ecosystems: biodiversity, animals, fish, plants… • ¨Materials/energy resources: ore and fossil fuel reserves, forests… • ¨Solid residues: municipal or industrial solid wastes • ¨Liquid emissions: inorganic and organic contaminants of fresh and ocean waters • ¨Gas emissions: inorganic and organic gases and particulate matter emitted to the atmosphere
Classes of Environmental Concerns Stage of industrial activity
Dimensional and dimensionless environmental metrics It is useful to express environmental performance indices, or “environmental metrics”, as ratios of one quantity, e.g., kilograms of emissions of NOx or CO2, to another, e.g. per kwh produced. This particular measure has the dimensions of mass/energy (kg/kWh) and is called “dimensional”. Also: the metric “kg copper in copper product A per kg of copper mined for manufacture of product A” has the dimensions of mass/mass and, therefore, is “dimensionless”
The “master environmental equation” • It consists of three terms: • ¨population • ¨material standard of living (Gross Domestic Product or GDP, in $) per person • ¨environmental impact per unit of material standard of living • _ reflects the level of technology used in industrial activities • With respect to global warming, the last term can be expressed as “tons of carbon dioxide equivalent, CO2,equ per $ of GDP” where “CO2,equ“ sums up all carbon dioxide and all other “greenhouse gases (GHG)” that have an equivalent effect
The three contributing factors are: • the size of population (e.g., China) • can be reduced by public awareness or government action • very high material standard of living (e.g. the U.S.) The GDP/capita term represents the material standard of living • and inefficient technology for fuel combustion and gas emission control (e.g. in developing nations). • indicative of the technology used to produce materials and energy and to control emissions.
The master environmental equation in algebraic form National environmental impact= (national population) x (GDP/capita) x (environmental impact/GDP)
Proposal: The “incremental master environmental equation” The population of developing nations in Asia and Africa has exploded since the beginning of what we may call the “2nd industrial revolution” in the 1950’s. If this trend continues, the globe will face many severe problems besides global warming. Therefore, it isnecessaryfor the developed nations to curb their use of material and energy resources and also for the developing ones to curb population growth; or for both to be prepared to pay the consequences of irresponsible behavior.
Proposal: It may be useful to establish an “incremental master environmental equation” that uses the year 1950 as a time reference point and to compute the change in the three contributing terms from1950 to present or future time, t: t (National environmental impact) = t [(national population) x (GDP/capita) x (environmental impact/GDP)] where the increment t represents the product of the three terms at time t minus the same product in 1950.
million tons Tons per capita 1991 inputs in the U.S. economy (after Wernick and Ausubel 1995) (part 1) Coal Crude oil Natural gas Other petroleum products 843.2 667.1 377.6 62.8 3.34 2.64 1.49 0.25 Total fossil fuels 1950.7 7.72 Crushed stone Sand and gravel 1092.8 827.5 4.32 3.27 Total construction minerals 1920.3 7.60 Salt Phosphate rock Clays Industrial sand and gravel Gypsum Nitrogen minerals Lime Sulfur Cement Soda ash All other 40.6 39.9 38.8 24.8 22.9 16.6 16.0 13.1 11.5 6.9 17.7 0.16 0.16 0.15 0.10 0.09 0.07 0.06 0.05 0.05 0.03 0.07
Total industrial minerals 248.8 0.98 Iron and steel Aluminum Copper All other 99.9 5.3 2.2 4.2 0.40 0.02 0.01 0.02 Total metals 111.6 0.44 Saw timber Pulpwood Fuel wood All other 122.9 72.8 51.5 12.6 0.49 0.29 0.20 0.05 Total forestry products 259.8 1.03 Grains Hay Fruit and vegetables Milk products Sugar crops Oilseeds Meat and poultry All other 219.7 133.2 70.5 63.2 50.6 44.7 42.3 4.9 0.87 0.53 0.28 0.25 0.20 0.18 0.17 0.02 Total agriculture 629.1 2.49 Total U.S. material inputs 5120.3 20.25 1991 inputs in the U.S. economy (after Wernick and Ausubel 1995) part 2
million tons Tons per capita Domestic stocks: Construction All other 1677.1 203.2 6.63 0.80 Total domestic stocks 1880.3 7.44 Atmospheric emissions: Carbon as CO2 Hydrogen Methane Carbon as CO NOx Volatile Organic Carbon (VOC) Sulfur as SO2 Particulate matter 1367.0 254.6 29.1 29.0 19.4 17.6 10.4 5.5 5.41 1.01 0.12 0.11 0.08 0.07 0.04 0.02 Total atmospheric emissions 1734.7 6.85 Residues and wastes: Processing wastes Coal ash Municipal/commercial waste Yard waste Food waste Water and wastewater sludge 136.2 85.0 276.4 35.0 13.2 9.4 0.54 0.34 1.09 0.14 0.05 0.04 Total residues and wastes 555.2 2.20 Total recycled materials 243.8 0.96 Total U.S. materials output 4411.9 17.45 1991 material outputs of the U.S. economy (after Wernick and Ausubel 1995)
Million tons of wastes Million tons of production tons of waste per ton produced Coal, surface mining Coal, cleaning 10042 84 843 12.0 Oil & gas produced wastes Oil & gas drilling fluids 3318 57.2 1044.7 3.2 Ore wastes in metal mining “Tailings” from ore concentration 755 409 111.6 10.4 Ore wastes in phosphate mining “Tailings” from ore concentration 262 108 39.9 9.3 Mining and mineral concentration wastes generated per unit of production
National material flows One of the most useful metrics is the annual use of various materials per person. It is readily obtained from published census and production records that all nations keep.
Nation Germany Japan Netherlands U.S.A. Population, millions 80.0 124.0 22.5 252.8 Consumption, tons/capita: Oil, coal, gas 6.2 3.3 6.4 7.7 Minerals and metals 10.7 11.8 5.9 8.0 Biomass 2.6 1.5 10.2 3.0 Total domestic consumption 19.5 16.6 22.5 18.7 1991 domestic consumption of materials in industrial countries (Fischer-Kowalski and Hutter, 1998)
Name Dimensions Higher values indicate Hydrogen to carbon ratio Mass H / mass C lower carbon emissions per unit of energy generated Intensity of material use $ of GDP/kg of material economic usefulness of material Intensity of carbon use $of GDP/kg of carbon emitted decarbonization of process/product Fertilizer productivity Tons produce/ton of fertilizers used lower emissions of fertilizers to environment Recycled material use Mass of recycled material/ (recycled plus virgin material) conservation of primary materials Restoration of forest resources Mass of forest growth/forest products harvested global carbon balance, less ecosystem disruption Dissipation index 1- mass of materials dissipated into environment during production / mass materials produced efficiency of use of materials; also avoidance of contamination Some useful indices of environmental performance (after Wernick and Ausubel, 1995)
Material Global production million tons Use by U.S. economy million tons U.S. fraction of global % Plastics 78.3 25 31.9 Synthetic fiber 13.2 3.9 29.5 Aluminum 17.8 5.3 29.8 Phosphate 15.7 4.4 28.0 Copper (new metal) 8.8 2.2 25.0 Fraction of global production of materials used by the U.S. economy (1990, ref.), part 1
Material Global production million tons Use by U.S. economy million tons U.S. fraction of global % Salt 202.3 40.6 20.1 Potash 28.3 5.5 19.4 Sand, gravel 133.1 24.8 18.6 Iron and steel 593.7 99.9 16.8 Nitrogen 107.9 18 16.7 Cement 1251.1 81.3 6.5 Fraction of global production of materials used by the U.S. economy (1990, ref.), part 2
Relation of an industrial subsystem to the economic, social and Earth systems
Environmental indicators at the firm level Economic indicator of productivity efficiency = Parameters System En: Energy Environment R: Raw materials “ W: Waste “ L: Labor Social Em: Employment “ M: Marketable output “ C: Capital Economic VA: Value added “
Environmental indicators at the firm level Social productivity efficiency = Parameters System En: Energy Environment R: Raw materials “ W: Waste “ L: Labor Social Em: Employment “ M: Marketable output “ C: Capital Economic VA: Value added “
Environmental indicators at the firm level Environmental productivity efficiency = Parameters System En: Energy Environment R: Raw materials “ W: Waste “ L: Labor Social Em: Employment “ M: Marketable output “ C: Capital Economic VA: Value added “