Evolution of Storage and CPU Metrics: 1980-2005
This overview analyzes the historical trends in storage technologies, including SRAM, DRAM, and disk storage from 1980 to 2005, showcasing the significant drops in cost per megabyte and improvements in access times. The evolution of CPU clock rates and memory caching systems illustrates the growing CPU-memory gap and advancements in cache management techniques. Key metrics highlight how these technologies have transformed both performance and capacity, providing insights critical for understanding past advancements and predicting future trends in computing.

Evolution of Storage and CPU Metrics: 1980-2005
E N D
Presentation Transcript
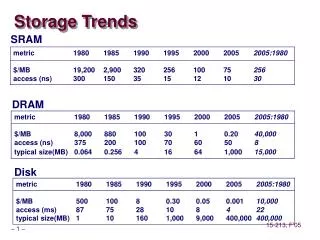
Storage Trends SRAM metric 1980 1985 1990 1995 2000 2005 2005:1980 $/MB 19,200 2,900 320 256 100 75 256 access (ns) 300 150 35 15 12 10 30 DRAM metric 1980 1985 1990 1995 2000 2005 2005:1980 $/MB 8,000 880 100 30 1 0.20 40,000 access (ns) 375 200 100 70 60 50 8 typical size(MB) 0.064 0.256 4 16 64 1,000 15,000 Disk metric 1980 1985 1990 1995 2000 2005 2005:1980 $/MB 500 100 8 0.30 0.05 0.001 10,000 access (ms) 87 75 28 10 8 4 22 typical size(MB) 1 10 160 1,000 9,000 400,000 400,000
CPU Clock Rates 1980 1985 1990 1995 2000 2005 2005:1980 processor 8080 286 386 Pentium P-III P-4 clock rate(MHz) 1 6 20 150 750 3,000 3,000 cycle time(ns) 1,000 166 50 6 1.3 0.3 3,333
Cache Type What is Cached? Where is it Cached? Access time (cycles) Managed By Registers 4-byte words CPU core 0 Compiler TLB Address translations On-Chip TLB 0 Hardware L1 cache 64-byte blocks On-Chip L1 1 Hardware L2 cache 64-byte blocks Off-Chip L2 10 Hardware Virtual Memory 4-KB page Main memory 100 Hardware+OS Buffer cache Parts of files Main memory 100 OS Network buffer cache Parts of files Local disk 10,000,000 AFS/NFS client Browser cache Web pages Local disk 10,000,000 Web browser Web cache Web pages Remote server disks 1,000,000,000 Web proxy server Examples of Caching in the Hierarchy


![[Storage]](https://cdn3.slideserve.com/5804430/slide1-dt.jpg)