Download
1 / 44
440 likes | 551 Vues
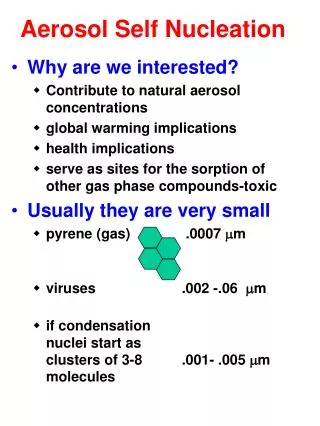
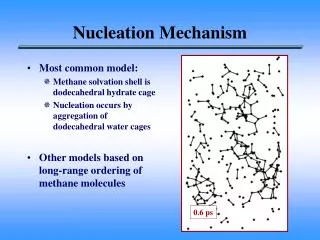
Study of gas-liquid nucleation rates using computer simulations and Monte Carlo methods. Detailed molecular dynamics simulations of vapor to liquid nucleation processes. Analysis of cluster free energies and critical nucleus sizes. Comparison with classical models and experimental data. Insights into homogeneous nucleation mechanisms and diffusion processes. Importance of surface tension in predicting nucleation rates accurately.

E N D
Computer Simulations, Nucleation Rate Predictions and Scaling Barbara Hale Physics Department and Cloud and Aerosol Sciences Laboratory,University of Missouri – RollaRolla, MO 65401 USA
Computer simulation techniques and predictions of vapor to liquid nucleation rates • Molecular Dynamics: time dependent simulation of nucleation process in a (usually dense) vapor. • Monte Carlo: statistical mechanical calculations of small n-cluster free energies of formation from the vapor , Gn
Monte Carlo Simulations Randomly generate molecular equilibrium configurations use “importance”, samplinginstatistical mechanical ensemble: U = Ufinal –Uinitial = change in potential energy Canonical (N,T,V) exp -[ U] /kT Gibbs (N,T,P) exp –[ U +PV] /kT Grand Can. (,T,V) exp –[ U - N ] /kT Metropolis method: exp[ –U/ kT] > Random # ; 0 < R < 1 accept Smart Monte Carlo: umbrella sampling, …
Nucleation rate via Monte Carlo • Calculate: < Gn > = < Gn – nG1> = free energy of formation (schemes for doing this depend on n-cluster definition, interaction potential and simulation efficiency…. must calculate free energy differences.) Nn/N1 = exp - < Gn>/kT = n-cluster size distribution or • Simulate: <Nn/N1> in “larger” supersaturated system Gn= - kT ln <Nn/N1>
Nucleation rate via Monte Carlo From simulation: Jn = monomer flux ·N1 e -G(n)/kT Predict Nucleation rate, J: • J [N1v1 4rn*2 ]· N1 e -G(n*)/kT ( often a classical model form is used) • J -1 = [n Jn' ]-1 (steady-state nucleation rate summation)
Computer simulation study of gas-liquid nucleation in a Lennard-Jones system.P. R. Ten Wolde and D. Frenkel J. Chem. Phys. 109, 9901 (1998) We report a computer-simulation study of homogeneous gas-liquid nucleation in a Lennard-Jones system. Using umbrella sampling, we compute the free energy of a cluster as a function of its size. A thermodynamic integration scheme is employed to determine the height of the nucleation barrier as a function of supersaturation. Our simulations illustrate that the mechanical and the thermodynamical surfaces of tension and surface tension differ significantly. In particular, we show that the mechanical definition of the surface tension cannot be used to compute this barrier height. We find that the relations recently proposed by McGraw and Laaksonen J. Chem. Phys. 106, 5284 (1997) for the height of the barrier and for the size of the critical nucleus are obeyed.
Numerical calculation of the rate of homogeneousgas–liquid nucleation in a Lennard-Jones systemP. R. Ten Wolde and D. Frenkel J. Chem. Phys. 110, 1591 (1999) We report a computer-simulation study of the absolute rate of homogeneous gas–liquid nucleation in a Lennard-Jones system. The height of the barrier has been computed using umbrella sampling, whereas the kinetic prefactor is calculated using molecular dynamics simulations. The simulations show that the nucleation process is highly diffusive. We find that the kinetic prefactor is a factor of 10 larger than predicted by classical nucleation theory.
P. R. Ten Wolde and D. Frenkel J. Chem. Phys. 110, 1591 (1999) • (N,P,T) Monte Carlo, N = 864 particles • S = 1.53; G/kT = 59.4 • T = 80.9K = 0.741 ; • JMC/MD = 4.5 x 105 cm-3sec-1 • Tc = 130K = 1.085 (LJ truncated 2.5, shifted)
Molecular Dynamics Simulations • Solve Newton’s equations, mi d2ri/dt2 = Fi = -ij≠i U(rj-ri), iteratively for all i=1,2… n atoms; • Quench the system to temperature, T, and monitor cluster formation. • MeasureJ rate at which clusters form
Molecular dynamics of homogeneous nucleation in the vapor phase. II. Water.K. Yasuoka and M. MatsumotoJ. Chem. Phys. 109, 8463 (1998) Homogeneous nucleation process in the vapor phase of water is investigated with a molecular dynamics computer simulation at 350 K under supersaturation ratio 7.3. Using a method similar to Lennard-Jones fluid (Part I), the nucleation rate is three orders of magnitude smaller than prediction of a classical nucleation theory. The kinetically defined critical nucleus size is 30–45, much larger than the thermodynamically defined value of 1.0 estimated with the classical theory. Free energy of cluster formation is estimated from the cluster size distribution in steady state time region. The predicted nucleation rate with this free energy agrees with the simulation result. It is concluded that considering the cluster size dependence of surface tension is very important.
Molecular dynamics of homogeneous nucleation in the vapor phase. I. Lennard-Jones fluidK. Yasuoka and M. MatsumotoJ. Chem. Phys. 109, 8451 (1998) Molecular dynamics computer simulation was carried out to investigate the dynamics of vapor phase homogeneous nucleation at the triple point temperature under supersaturation ratio 6.8 for a Lennard-Jones fluid. To control the system temperature, the 5000 target particles were mixed with 5000 soft-core carrier gas particles. The observed nucleation rate is seven orders of magnitude larger than prediction of a classical nucleation theory. The kinetically defined critical nucleus size, at which the growth and decay rates are balanced, is 30–40, as large as the thermodynamically defined value of 25.4 estimated with the classical theory. From the cluster size distribution in the steady state region, the free energy of cluster formation is estimated, which diminishes the difference between the theoretical prediction and the simulational result concerning the nucleation rate.
K. Yasuoka and M. MatsumotoJ. Chem. Phys. 109, 8463 (1998) =2.15ps
K. Yasuoka and M. MatsumotoJ. Chem. Phys. 109, 8463 (1998) =2.15ps
K. Yasuoka and M. MatsumotoJ. Chem. Phys. 109, 8463 (1998)MD Lennard-Jones • S = 6.8 • T = 80.3K = 0.67 • JMD 1029 cm-3sec-1 107Jclassical • Tc= 161.7K = 1.35 How can this be compared with experiment?
Difficulties in comparing with experimental data • Simulation results depend on potential model. The classical atom-atom interaction potentials can have different surface tension, coexistence vapor pressure, critical temperature. • Results can depend on the definition of a cluster and other simulation constraints. • How to compare results with experiment?
Scaled SupersaturationB. N. Hale, Phys. Rev. A 33, 4156 (1986) T dependence of the scaled nucleation rate: ln[Jscaled /1026 ]cgs-(16/3) 3 [lnS/(Tc/T -1)3/2]-2 Scaled Supersaturation : lnSscaled = lnS/(Tc/T -1)3/2 2 ( argon excess surface entropy/molecule) 1.5 (water excess surface entropy/molecule)
Toluene nucleation rate data of Schmitt et al plotted vs. scaled supersaturation, Co = [Tc /240-1]3/2 ; Tc = 591.8K
Nonane nucleation rate data of Adams et al. plotted vs. scaled supersaturation; Co = [Tc/240-1]3/2;Tc= 594.6K
Water nucleation rate data of Wölk and Strey plotted vs. lnS / [Tc/T-1]3/2 ; Co = [Tc/240-1]3/2; Tc = 647 K
Using scaled supersaturations to compare experimental data and computer simulation predictions for J Plot -log[J/1026]cgs units vs. Co' / [lnSscaled]2 Co' = 23.1 = -(16/3) 3/ln(10) with = 1.47 Tc= 647 K and use Sexp or Smodel
Comments on water data and predictions for J • Predictions using TIP4P are about 4 orders of magnitude too large, but have right T dependence. • TIP4P critical temperature < 647K • MD and MC show similar results. • TIP4P surface tension 35% too small.
Argon rate data and Lennard-Jones computer simulations Plot -log[J/1026]cgs unitsvs. Co' / [lnSscaled]2 Co' = -(16/3) 3 = 24.6 with = 1.5 use (Tc= 150 K, Sexp) for data; (Tc model , Smodel) for simulation results.
+ Fladerer Zahoransky
+ Fladerer Zahoransky ○ Stein
+ Fladerer Zahoransky ○ Stein Mathew et al.
+ Fladerer Zahoransky ○ Stein Mathew et al. X Wu et al.
+ Fladerer Zahoransky ○ Stein Mathew et al. X Wu et al. Calculations: ● tenWolde
+ Fladerer Zahoransky ○ Stein Mathew et al. X Wu et al. Calculations: ● tenWolde ■ Yasuoka and Matsumoto
+ Fladerer Zahoransky ○ Stein Mathew et al. X Wu et al. Calculations: ● tenWolde ■ Yasuoka and Matsumoto ▼ Senger, Reiss, et al.
+ Fladerer Zahoransky ○ Stein Mathew et al. X Wu et al. Calculations: ● tenWolde ■ Yasuoka and Matsumoto ▼ Senger, Reiss, et al. ▲ Oh and Zeng
+ Fladerer Zahoransky ○ Stein Mathew et al. X Wu et al. Calculations: ● ten Wolde ■ Yasuoka and Matsumoto ▼ Senger, Reiss, et al. ▲ Oh and Zeng ♦Chen et al.
+ Fladerer Zahoransky ○ Stein Mathew et al. X Wu et al. Calculations: ● ten Wolde ■ Yasuoka and Matsumoto ▼ Senger, Reiss, et al. ▲ Oh and Zeng ♦Chen et al. □ Hale
+ Fladerer Zahoransky ○ Stein Mathew et al. X Wu et al. Calculations: ● ten Wolde ■ Yasuoka and Matsumoto ▼ Senger, Reiss, et al. ▲ Oh and Zeng ♦Chen et al. □ Hale, Kiefer □CNT (Fladerer)
+ Fladerer Zahoransky ○ Stein Mathew et al. X Wu et al. Calculations: ● ten Wolde ■ Yasuoka and Matsumoto ▼ Senger, Reiss, et al. ▲ Oh and Zeng ♦Chen et al. □ Hale, Kiefer □CNT (Fladerer) --- Scaled model, = 2.0 --- Scaled model, = 1.5
Comments on argon data and predictions for J • Limited experimental rate data for argon; no rate dependence on temperature; • Lennard-Jones MC and MD simulations at small scaled supersaturations (high nucleation rates) appear to be consistent. • Monte Carlo LJ simulations at higher scaled supersaturations (lower nucleation rates) are a factor of 10-20 too small. • ten Wolde’s predicted rate is close to Fladerer’s experimental rate (but the model Tc = 129K and surface tension is about 50% too small).