Download
1 / 1
10 likes | 139 Vues
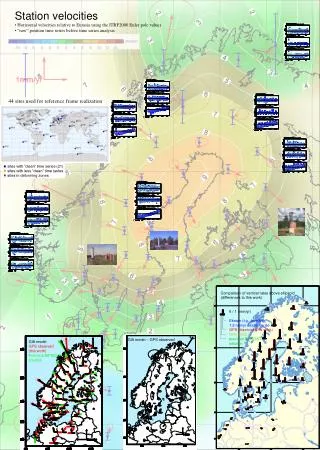
This study examines the vertical rates observed at 44 GPS sites, focusing on those with "clean" time series and those in deforming zones. We compare the observed GPS data with GIA models, including the previous BIFROST solution, revealing differences in vertical rates above the ellipsoid. Key findings include the 5.1 mm/year difference in vertical rates, contributing to a sea level rise estimate of 1.2 mm/year. Further analysis explores station velocities and horizontal velocities relative to Eurasia, using the ITRF2000 Euler pole values.

E N D
sites with ”clean” time series (21) • sites with less ”clean” time series • sites in deforming zones Comparison of vertical rates above ellipsoid (differences to this work) 5 / 1 (mm/yr) Ekman (t.g., levelling) 1.2 mm/yr sea level rise GPS observed (this work) GIA model previous BIFROST solution GIA model – GPS observed GIA model GPS observed (this work) Previous BIFROST solution • Station velocities • Horizontal velocities relative to Eurasia using the ITRF2000 Euler pole values • “raw” position time series before time series analysis 44 sites used for reference frame realization