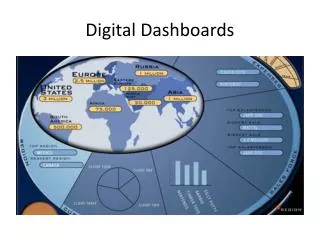
Visualization Ideas for Management Dashboards
320 likes | 493 Vues
Visualization Ideas for Management Dashboards. John Shade CERN IT/GD. CERN - IT Department CH-1211 Genève 23 Switzerland www.cern.ch/i t. How will we spend 20’?. Quick overview of current displays/tools Examples of 3rd party dashboards What do we want from a Management Dashboard?

Visualization Ideas for Management Dashboards
E N D
Presentation Transcript
Visualization Ideas for Management Dashboards John Shade CERN IT/GD CERN - IT Department CH-1211 Genève 23 Switzerland www.cern.ch/it
How will we spend 20’? • Quick overview of current displays/tools • Examples of 3rd party dashboards • What do we want from a Management Dashboard? • Some observations • Q & A J.Shade: Visualization Ideas for Management Dashboards
CIC Dashboard J.Shade: Visualization Ideas for Management Dashboards
SAM “dashboard” J.Shade: Visualization Ideas for Management Dashboards
GStat J.Shade: Visualization Ideas for Management Dashboards
GridIce J.Shade: Visualization Ideas for Management Dashboards
NAGIOS J.Shade: Visualization Ideas for Management Dashboards
WiatG J.Shade: Visualization Ideas for Management Dashboards
GridView J.Shade: Visualization Ideas for Management Dashboards
GridMap J.Shade: Visualization Ideas for Management Dashboards
GridMap (site reliability) J.Shade: Visualization Ideas for Management Dashboards
ExperimentDashboards • ALICE • ATLAS • CMS • LHCb • Site efficiency reports J.Shade: Visualization Ideas for Management Dashboards
ALICE (site efficiency) J.Shade: Visualization Ideas for Management Dashboards
ATLAS data transfers J.Shade: Visualization Ideas for Management Dashboards
CMSI/O rate monitoring J.Shade: Visualization Ideas for Management Dashboards
GridPP reports J.Shade: Visualization Ideas for Management Dashboards
Examples of 3rd party dashboards J.Shade: Visualization Ideas for Management Dashboards
VitalStream.com J.Shade: Visualization Ideas for Management Dashboards
DashboardSpy.com J.Shade: Visualization Ideas for Management Dashboards
HP OpenView J.Shade: Visualization Ideas for Management Dashboards
Obvient.com J.Shade: Visualization Ideas for Management Dashboards
What do we want from a Management Dashboard? • “show the state and spot problems” • per-VO, up-to-the-minute, view of the infrastructure • how much of available resources are being used? • how many jobs are running, are queued, why are they queued? (i.e. any issues) • need to include jobs not submitted via the RB • what resources are available to [e.g. ATLAS] per site, per region? • include data transfers (view of problems) FTS, GridFTP and others J.Shade: Visualization Ideas for Management Dashboards
What do we want from a Management Dashboard? (contd.) • Need a summary for each of the 5-6 largest VOs • Need operations view to spot "black holes“ • Consolidation of data from disparate data sources J.Shade: Visualization Ideas for Management Dashboards
Some Observations • “the information is there, but needs to be summarized” • Observations: • GridView navigation is tedious. The graphs are useful • GridMaps are a good way of conveying a lot of information at a glance • Explorer is good for navigating hierarchies J.Shade: Visualization Ideas for Management Dashboards
1st Pass at a Management View J.Shade: Visualization Ideas for Management Dashboards
VO selection (or All) Site availability/reliability table Explorer navigation linked to GridMap GridMap controls (CPUs, storage, jobs, data transfers etc.) EGEE Operations Management Dashboard
Possible site-specific pop-up AEGIS01 J.Shade: Visualization Ideas for Management Dashboards
Displaying historical data Possible ways for GridView to display graphs – note the horizontal scroll-bar that allows scrolling back in time. J.Shade: Visualization Ideas for Management Dashboards
Topology View show how key components are interconnected e.g (ui-> wms-> bdii), (sam-->wsm->bdii) show the inter-dependencies between services. E.g. what dies if I kill service X? J.Shade: Visualization Ideas for Management Dashboards
Navigation & Status Hierarchical View , with colour-coded percolation of status Allows quick navigation to problem element Check tools that provide Business Process Views (eg. BMC Patrol, Unicenter TNG) J.Shade: Visualization Ideas for Management Dashboards
Key Points • Custom views are desirable • Consider using existing toolkits • Make navigation easy • Data from existing tools should be exportable (XML) • Remember the Goal: At-a-glance understanding of important metrics J.Shade: Visualization Ideas for Management Dashboards
Q & A J.Shade: Visualization Ideas for Management Dashboards