Download
1 / 23
230 likes | 345 Vues
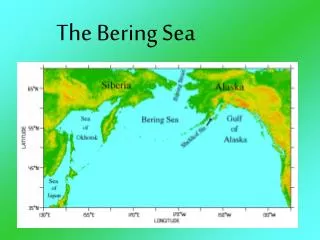
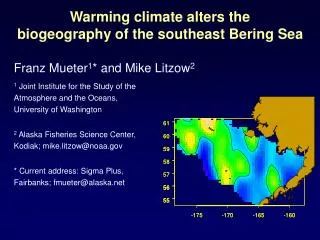
Warming climate alters the biogeography of the southeast Bering Sea. Franz Mueter 1 * and Mike Litzow 2. 1 Joint Institute for the Study of the Atmosphere and the Oceans, University of Washington 2 Alaska Fisheries Science Center, Kodiak; mike.litzow@noaa.gov

E N D
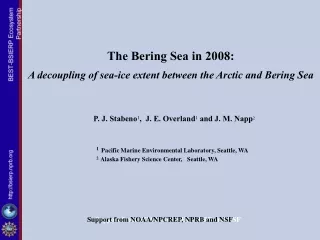
Warming climate alters the biogeography of the southeast Bering Sea Franz Mueter1* and Mike Litzow2 1 Joint Institute for the Study of the Atmosphere and the Oceans, University of Washington 2 Alaska Fisheries Science Center, Kodiak; mike.litzow@noaa.gov * Current address: Sigma Plus, Fairbanks; fmueter@alaska.net
0 0 20 20 40 40 60 60 Winter sea ice drives summer bottom temperatures High-ice year (1997) Depth (m) Low-ice year (1998) Jan Feb Mar Apr May Jun Jul Aug Sep Oct Nov Dec Redrawn from Stabeno et al. 2001. Fisheries Oceanography 10:81-98 °C -2 0 2 4 6 8 10 12 14
Summer bottom temperature °C P = 0.04 Winter ice extent P = 0.01 Ice cover index The problem – persistent climate forcing
Objectives • Use NMFS bottom trawl survey (1982-2006) to describe community response to warming • Identify outstanding questions for predicting response to future warming
2 1 0 -1 -2 Northward shift in biomass Change in total CPUE 1982-1986 to 2002-2006 Change in biomass (CPUE0.25, tons / km2) °N °W 51 taxa consistently identified through time series: 9 Arctic taxa / 42 subarctic taxa, 10 crustaceans / 41 fishes
Shifts in North-South gradients, averaged among 51 taxa P = 0.0095 P < 0.001 CPUE-where-present Probability of occurrence North 0.10 0.03 0.00 0.01 Latitudinal gradient -0.10 -0.01 -0.20 -0.03 South 1985 1990 1995 2000 2005 1985 1990 1995 2000 2005 Year Year
Snow crab Rock sole Halibut Pollock Mean shift = 31 km One-sample t = 3.50 P = 0.0005 Rate similar to North Sea (Perry et al. 2005) 2-3 times faster than terrestrial mean (Parmesan and Yohe 2003) Shifts in center of distribution for 45 taxa, 1982-2006
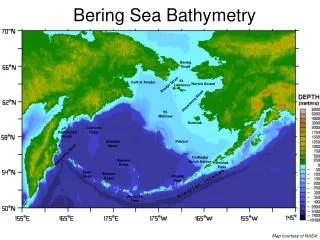
0 2 4 6 8 Retreat of the cold pool 1982-1986 55 57 59 61 °N 175 170 165 160 °W Summer bottom temperature (°C)
Retreat of the cold pool Predictions: Increased subarctic:Arctic community biomass Increased diversity Increased average trophic level
Changing community structure in the cold pool Ratio Arctic:subarctic biomass 0.30 P < 0.01 0.25 0.20 Arctic CPUE:subarctic CPUE 0.15 0.10 0.05 1985 1990 1995 2000 2005 Year
16 15 14 13 12 Changing community structure in the cold pool Diversity (species richness) P < 0.01 Species / haul 1985 1990 1995 2000 2005 Year
Changing community structure in the cold pool Mean trophic level 3.76 P < 0.01 3.74 3.72 Trophic level 3.70 3.68 3.66 1985 1990 1995 2000 2005 Year
Climate – biogeography links Arctic and subarctic biomass in cold pool area R2 = 0.70 Subarctic taxa R2 = 0.08 Arctic taxa Mean bottom temperature (° C)
Climate – biogeography links Mean trophic level of survey catches in cold pool area R2 = 0.39 Mean bottom temperature (° C)
16 12 8 4 0 Climate – commercial fisheries links Commercial snow crab catch, 1982-2005 R2 = 0.59 Catch (104 t) Ice cover index (3-yr running mean)
Climate – commercial fisheries links Mean trophic level of total commercial catch, 1982-2004 R2 = 0.36 Trophic level Ice cover index (3-yr running mean)
What we don’t know, #1: what else besides direct temperature effects is driving distribution shifts? 20 20 b) Residual trend a) Direct temp. effect 10 10 Latitudinal displacement (km) 0 0 -10 -10 -20 -20 1.0 2.0 3.0 4.0 1985 1995 2005 Average bottom temperature (oC) Year Even after temperature effects removed, significant northward displacement remains Center of distribution averaged over 45 taxa
What we don’t know, #2: what explains variability in distribution shifts? Change in center of distribution for 45 taxa, 1982-2006 General Linear Model to explain variability among taxa: Effect P Commercial status (fished vs. non-fished) Temperature preference (from survey) Trophic level Maximum length (for fish) 0.80 0.67 0.12 0.83
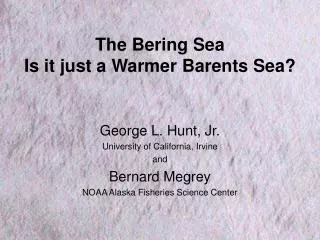
Conclusions Warming of the Bering Sea since 1982: Community-wide northward shift Community reorganization in cold pool area Change in fisheries
Conclusions Continued warming: Loss of Arctic species, increase in subarctic species Variability in shifts = potential for new community state Need to understand: How biotic interactions constrain response to warming Emergent effects
Acknowledgements Everyone who has participated in the annual Bering Sea survey for the last 25+ years Claire Armistead, Bern Megrey and Jeff Napp for their assistance