Ch. 1-5 Scatter Plots
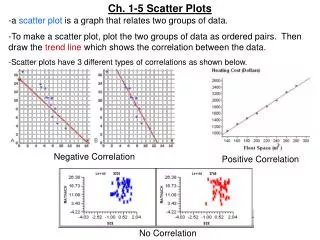
Ch. 1-5 Scatter Plots. -a scatter plot is a graph that relates two groups of data. -To make a scatter plot, plot the two groups of data as ordered pairs. Then draw the trend line which shows the correlation between the data.

Ch. 1-5 Scatter Plots
E N D
Presentation Transcript
Ch. 1-5 Scatter Plots -a scatter plot is a graph that relates two groups of data. -To make a scatter plot, plot the two groups of data as ordered pairs. Then draw the trend line which shows the correlation between the data. -Scatter plots have 3 different types of correlations as shown below. Negative Correlation Positive Correlation No Correlation
It’s graphing calculator time!! Yeah!!!!
Example 1: Make a scatter plot for the data below, draw the trend line, and describe the correlation. a.) Jean Sales What are the dependent and independent variables? What is the domain and range? Dependent Variable: Number Sold Independent Variable: Average Price Range: 130, 112, 82, 65 Domain: $21, $28, $36, $40
b.) Gasoline Purchases What are the dependent and independent variables? What is the domain and range? Dependent Variable: Dollars spent Independent Variable: Gallons bought Range: 10, 11, 9, 13, 5, 8 Domain: 6.3, 6.1, 5.6, 8.3, 2.9, 5.2
Example 2: Tell whether each set of data would more likely give you a positive, negative, or no correlation. a.) the amount of free time you have and the number of classes you take. b.) the sale of snow shovels and the amount of snowfall. c.) the number of cavities you get and the number of times you brush your teeth. d.) the length of a baby at birth and the month they were born in. Negative correlation, the more classes you take, the less free time you have. Positive correlation, the more snow, the greater the sales of snow shovels. Negative correlation, the more you brush your teeth the fewer cavities you have. No correlation