Download
1 / 16
170 likes | 553 Vues
Parts of Chapters 5 and 9 Consumer Surplus, Producer Surplus and Welfare Measurement. 5.1 Consumer Welfare. How much are consumers helped or harmed by shocks that affect the equilibrium price and quantity?

E N D
Parts of Chapters 5 and 9Consumer Surplus, Producer Surplus and Welfare Measurement
5.1 Consumer Welfare How much are consumers helped or harmed by shocks that affect the equilibrium price and quantity? Shocks may come from new inventions that reduce firm costs, natural disasters, or government-imposed taxes, subsidies, or quotas. A measure of consumer welfare is consumer surplus in terms of dollars.
5.1 Consumer Surplus Consumer surplus (CS) is the monetary difference between the maximum amount that a consumer is willing to pay for the quantity purchased and what the good actually costs. Step function
5.1 Consumer Surplus Consumer surplus (CS) is the area under the inverse demand curve and above the market price up to the quantity purchased by the consumer. Smooth inverse demand function
9.1 Zero Profit for Competitive Firms in the Long Run With Free Entry into the Market Along with identical costs and constant input prices, implies firms each face a horizontal LR supply curve Firms operate at minimum LR average cost Firms earn zero economic profit in the LR When Entry into the Market is Limited May occur because of limited supply of an input Bidding for scarce input drives up input price LR economic profit is still driven to zero
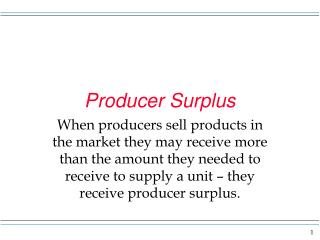
9.2 Producer Welfare Producer surplus (PS) is the difference between the amount for which a good sells (market price) and the minimum amount necessary for sellers to be willing to produce it (marginal cost). Step function
9.2 Producer Welfare Producer surplus (PS) is the area above the inverse supply curve and below the market price up to the quantity purchased by the consumer. Smooth inverse supply function
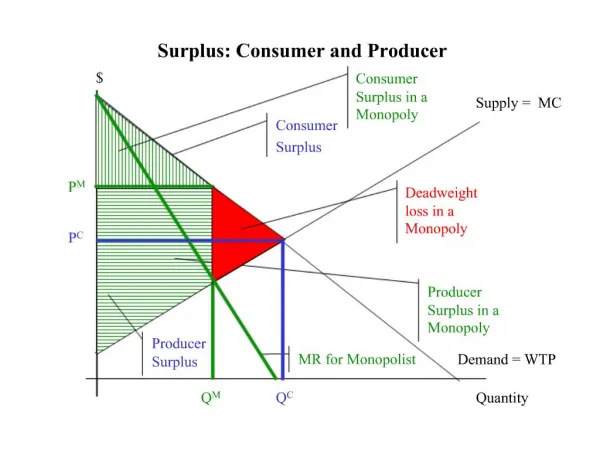
9.3 How Competition Maximizes Welfare How should we measure society’s welfare? If we are ok with weighting the well-being of consumers and producers equally, then welfare can be measured W = CS + PS Producing the competitive quantity maximizes welfare. Put another way, producing less than the competitive level of output lowers total welfare. Deadweight loss (DWL) is the name for the net reduction in welfare from the loss of surplus by one group that is not offset by a gain to another group.
9.3 How Competition Maximizes Welfare DWL is the opportunity cost of giving up some of this good to buy more of another good (C+E). • Producing more than the competitive level of output also lowers total welfare (by area B, which equals DWL).
9.5 Policies That Create a Wedge Between Supply and Demand Curves Welfare is maximized at the competitive equilibrium Government actions can move us away from that competitive equilibrium Thus, welfare analysis can help us predict the impact of various government programs We will examine several policies that create a wedge between S and D: Sales tax Price floor Price ceiling
9.5 Policies That Create a Wedge Between Supply and Demand Curves Sales Tax A new sales tax causes the price that consumers pay to rise and the price that firms receive to fall. The former results in lower CS The latter results in lower PS New tax revenue is also generated by a sales tax and, assuming the government does something useful with the tax revenue, it should be counted in our measure of welfare:
9.5 Policies That Create a Wedge Between Supply and Demand Curves Sales tax creates wedge that generates tax revenue of B+D and DWL of C+E.
9.5 Policies That Create a Wedge Between Supply and Demand Curves Price Floor A price floor, or minimum price, is the lowest price a consumer can legally pay for a good. Example: agricultural products Minimum price is guaranteed by government, but is only binding if it is above the competitive equilibrium price. Deadweight loss generated by a price floor reflects two distortions in the market: Excess production: More output is produced than consumed Inefficiency in consumption: Consumers willing to pay more for last unit bought than it cost to produce
9.5 Policies That Create a Wedge Between Supply and Demand Curves Price floor creates wedge that generates excess production of Qs – Qd and DWL of C+F+G.
9.5 Policies That Create a Wedge Between Supply and Demand Curves Price Ceiling A price ceiling, or maximum price, is the highest price a firm can legally charge. Example: rent controlled apartments Maximum price is only binding if it is below the competitive equilibrium price. Deadweight loss may underestimate true loss for two reasons: Consumers spend additional time searching and this extra search is wasteful and often unsuccessful. Consumers who are lucky enough to buy may not be the consumers who value it the most (allocative cost).
9.5 Policies That Create a Wedge Between Supply and Demand Curves Price ceiling creates wedge that generates excess demand of Qd – Qs and DWL of C+E.