Acoustic Seaglider
280 likes | 721 Vues
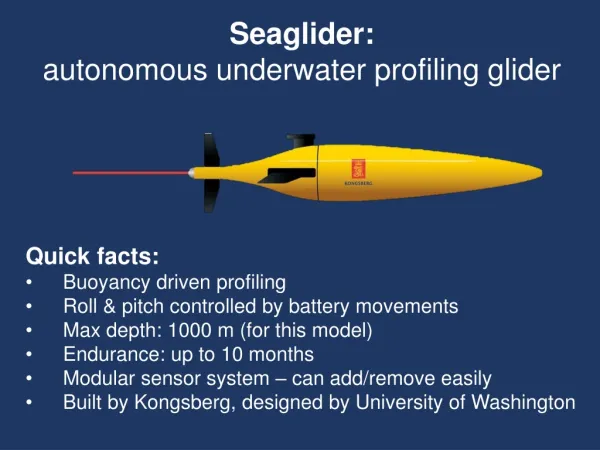
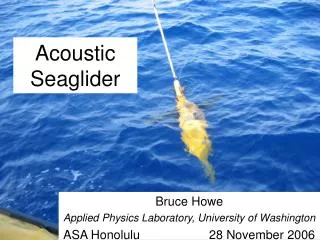
Acoustic Seaglider. Bruce Howe Applied Physics Laboratory, University of Washington ASA Honolulu 28 November 2006. Acoustic Seaglider. WHOI micromodem in nose Hydrophone in tail. Goals. Develop and demonstrate the acoustic Seaglider:

Acoustic Seaglider
E N D
Presentation Transcript
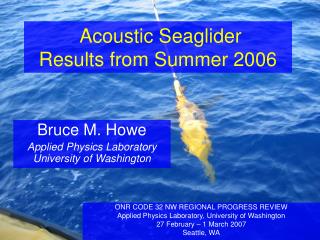
Acoustic Seaglider Bruce Howe Applied Physics Laboratory, University of Washington ASA Honolulu 28 November 2006
Acoustic Seaglider • WHOI micromodem in nose • Hydrophone in tail
Goals • Develop and demonstrate the acoustic Seaglider: • As a communications gateway between subsurface platforms and land • To act as a general purpose acoustic receiver for all signals and “noise”, with near-real time reporting of processed results
Outline • Overview – 3 field experiments • Seaglider acomms performance • Acoustic receiver performance: • External sources; biological sources ambient noise • Interaction with Kayaks - navigation • Surface current measurements • Concluding remarks
Acoustic Seaglider Operations – Summer 2006 Monterey Bay Kauai Philippine Sea Philippine Sea – SG022, 7/29/06-7/30/06, 1 day, 15 dives, low ARS band,CTD Monterey Bay – SG022, 8/15/06-8/21/06, 6 days, 61 dives, low ARS band,CTD SG023, 8/18/06-8/23/06, 5 days, 83 dives, low ARS band, CTD SG106, 8/12/06-8/18/06, 6 days, 131 dives, high + low ARS bands,CTD,mmodem Kauai - SG023, 8/31/06-10/8/06, 39 days, 143 dives, low ARS band, CTD
Positions during first mission where SG106 was able to read mmodem FSK packets during MB06 • Black circles are positions where SG106 was at surface after dive where no acomms CARXD packets were received. • Blue circles are dives where CARXD commands were logged (FSK message decoded) during dive. • 106 only sent one FSK command to turn off the ARL-UT array • Most FSK came from ARL-UT or Gateway. • Black “+” signs are glider dives after SG106 ceased recording acomms logs • 4-5 km ranges are evident ARL-UT bottom node 500 m Gateway Latitude Kelp Array First FSK packet at 08/15/2006,08:57 (UTC) from unit 6 to 13 Dive 22.
RXD receptions vs range and depth Histograms of depths for RXD receptions SG106 ascending SG106 descending Counts 0 20 40 60 Counts 0 10 20 30 40 0 20 40 60 80 100 120 140 depth (m) 0 50 100 depth(m)
ARS system can be used to validate mmodem performance – example 1st 30 sec of dive 41 20 10 Missed packet 30 glider pump noise 25 Missed packet 20 Freq (kHz) CACYC telling 6 to talk to 13 15 CARXD (32 byte FSK packet) from 5 to 13 CACYC packet telling 5 to talk to 13 10 5 30 21:24:14 UTC ACOMMS band – 23-27kHz Reference band – 15-19kHz { 30 10 20 Time (s) PSD @ 8-10 sec Simple ACOMMS detector: ratio of energy in 23-27 kHz band to energy in 15-19 kHz band 0 5 10 15 20 25 30 35 kHz
Ship source, harmonics and reverb ~10 nm from ship Dive 13, file 2 Frequency Distant source Time (s) 150 0 signals Example of Lubell source recorded at SG023 (dive 20 segment 2) MB06 LWAD
SG023 recorded the last 2 weeks of signals from the ATOC source off Kauai Example: arrival of ATOC signal on dive 43 (~30 km from source) 92.5 dB ATOC off 86 dB 78 dB ATOC on ATOC warmup 70 Hz 70 Hz ATOC onset = 43.76s into record Record start = 01:59:36 Signal arrival = 01:59:36 + 43.76s = 02:00:19.76 Travel time = 19.76 s Rough predicted travel time = 30km / 1.5km/s = 20 s 01:59:36 01:45:54 01:57:54
Whale sounds recorded on Seaglider ARS Monterey MB06 humpback Blue whale ‘D’ call Humpback (very close) Sea lions? birds Blue whale Blue whale ‘B’ call 3rd harmonic ~48 Hz Humpback @ 15 and 65 sec Blue @ 35 sec Sea Lions? @ 50 sec 1st harmonic ~16 Hz
Comparison of SG023 data: Monterey Bay vs Kauai • Similarities in peak structure indicated that they come from glider noise processes • Levels from shallow MB dive are higher • Keep in mind: • The data set for SG023 shallow dives in Monterey Bay is limited to one dive • There is considerable variability in the Kauai data
Glider – Kayak interactions in Monterey Bay Kayaks pinging to glider Graphs by Alexander Bahr MITComputerScience &ArtificialIntelligenceLaboratory
Monterey Bay MB06 SG023 was allowed to drift on the surface for 2 extended periods during MB06 The resulting drifts were compared to surface current predictions from the HOPS model Leg 25 Leg 83 Current shear event experienced by glider but not captured by model nowcast forecast
Concluding remarks • Demonstrated glider gateway capability – connecting subsurface platforms to shore via acoustic modem/satellite Iridium • Demonstrated functioning of acoustic receiver – man-made signals, whales, noise… with near-real time processed results • Potential – data truck, tactical sensors, marine mammal research tool, navigation node, surface drift, bottomed, …
R/V Montague and sg106 Thanks to many who contributed! Here Skip Denny and the ANTS crew ONR
Spectral features obscured by frequency resolution Exact causes of these ‘features’ is unknown Other sources acomms Look at several data records and average to get smoothed curves for comparisons • These are some ‘typical’ spectra from shallow dives of SG106 in Monterey Bay • We have chosen 50 sec intervals free of obvious interference for these spectra • The average values will be compared later to other glider data
Decimate the high band by 13 to get frequency resolution comparable to the low band • Spectral features compare across bands
Acomms details for sg106 dive 41 example (slide 7) The timing seems off in the graph compared to these values 5,08/15/2006,21:24:13,0x0,$CACFG,TXD,1000*095,08/15/2006,21:24:13,0x0,$CACFG,TXP,1*2D5,08/15/2006,21:24:13,0x0,$CACFG,TXF,1*3B5,08/15/2006,21:24:19,0x0,$CADQF,239,2*5B5,08/15/2006,21:24:19,0x0,$CAMFD,568,288,0197*675,08/15/2006,21:24:19,0x0,$CASHF,250,00,00,01,00*455,08/15/2006,21:24:19,0x0,$CACYC,1,5,13,0,0,1*6C5,08/15/2006,21:24:25,0x0,$CADQF,244,1*525,08/15/2006,21:24:25,0x0,$CAMFD,1822,925,0196*585,08/15/2006,21:24:25,0x0,$CASHF,250,00,00,01,00*455,08/15/2006,21:24:25,0x0,$CARXD,5,13,1,1,1b012b51388ee0d7836d5dcd229ad48ae08aa000000000000001400f01181180*515,08/15/2006,21:24:25,0x0,$CAREV,114221,AUV,0.92.0.19*055,08/15/2006,21:24:28,0x0,$CADQF,250,2*545,08/15/2006,21:24:28,0x0,$CAMFD,1158,364,0318*575,08/15/2006,21:24:28,0x0,$CASHF,250,00,00,01,00*455,08/15/2006,21:24:28,0x0,$CAACK,13,5,1,1*7C5,08/15/2006,21:24:38,0x0,$CAREV,114234,AUV,0.92.0.19*015,08/15/2006,21:24:41,0x0,$CADQF,250,2*545,08/15/2006,21:24:41,0x0,$CAMFD,718,272,0263*6F5,08/15/2006,21:24:41,0x0,$CASHF,250,00,00,01,00*455,08/15/2006,21:24:41,0x0,$CACYC,1,6,13,0,0,1*6F5,08/15/2006,21:24:47,0x0,$CADQF,233,1*525,08/15/2006,21:24:47,0x0,$CAMFD,218,121,0180*615,08/15/2006,21:24:47,0x0,$CASHF,250,00,00,02,00*465,08/15/2006,21:24:47,0x0,$CAMSG,BAD_CRC,1*205,08/15/2006,21:24:47,0x0,$CAREV,114243,AUV,0.92.0.19*015,08/15/2006,21:24:57,0x0,$CAREV,114253,AUV,0.92.0.19*005,08/15/2006,21:25:07,0x0,$CAREV,114303,AUV,0.92.0.19*045,08/15/2006,21:25:14,0x0,$CACYC,1,8,6,0,1,1*545,08/15/2006,21:25:14,0x0,$CATXP,2*40When 1b012b51388ee0d7836d5dcd229ad48ae08aa000000000000001400f01181180is decoded this is what I get.Mode=27, Rpt=CONTACT, Src=6, Dst=0, Time=-993425196, SHead=276.814851, SPitch=72.492669, SRoll=39.570103, Lat=-74.825830, Lon=-78.143353, Depth=409, CEP=716, Bear=189.408891, BearUnc=3.937008, BRate=3.874755, BRateUnc=1.161290, Elev=-86.641251, ElevUnc=0.944882, Lev1=71, Freq1=706, Bw1=-10, Lev2=6, Freq2=2160, Bw2=-9 21:24:18 from graph 21:24:21 from graph 21:24:27 missed packet 21:24:40 from graph 21:24:43 missed packet Not on graph
Range vs time (hours since arbitrary start) ARL-UT array Gateway buoy Kelp array
Directions (to true north) of RXD receptions by SG 106 in MB06 ARL-UT Gateway Kelp
SG106 Heading and range at times of RXD receptions True North Prevailing currents
Azimuth and range from Sg106 to source of RXD transmission Forward Starboard Port Aft