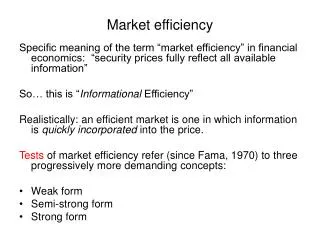
Market Efficiency
Market Efficiency. Random walk. In 1970s, Princeton professor Burton Malkiel wrote an influential book titled “A Random Walk Down Wall Street” He said that stock prices follow a “random walk”.

Market Efficiency
E N D
Presentation Transcript
Random walk • In 1970s, Princeton professor Burton Malkiel wrote an influential book titled “A Random Walk Down Wall Street” • He said that stock prices follow a “random walk”. • It is not possible to consistently and accurately predict where they are going based on where they have been in the past
Weak form efficiency • Gene Fama (Nobel Prize Winner in Economics in 2013) defined three different levels of market efficiency • Weak Form Efficiency claims that you cannot consistently earn abnormal returns by based on the study of past stock prices or trading volume • Technical Analysts (Chartists) would disagree
Semi-strong form efficiency • Semi-Strong Form Efficiency claims that you cannot consistently earn abnormal returns by based on the study of any publicly available information • Fundamental Analysts would disagree
strong form efficiency • Strong Form Efficiency claims that you cannot consistently earn abnormal returns even if you have access to non-public (private) information • The S.E.C. would disagree because they have made it illegal to trade on private information • Virtually no one believes that markets are strong-form efficient, but many believe they are weak or semi-strong form efficient
Early Evidence • Early evidence basically supported both the weak and the semi-strong form Efficient Markets’ Hypothesis (EMH).
Early Weak Form EMH Tests Positive Serial Correlation: • + returns follow + returns for a given stock or - returns follow - returns for a given stock • Called “momentum” or “inertia”
Early Weak Form EMH Tests Negative Serial Correlation: • + returns follow - returns for a given stock or - returns follow + returns for a given stock. • Called “reversals”
Tie to a Random Walk • If we find (+) or (-) serial correlation, this is evidence against the weak-form EMH as it implies that past prices can be used to predict future prices.
Early Weak Form EMH Tests No evidence of serial correlation. The price of a stock is just as likely to rise after a previous day’s increase as after a previous day’s decline.
Early Semi-Strong Form EMH Tests • Event studies looked at stock prices around the release of new information to the public. This was an effort to see if the market quickly incorporated new information into the prices of stocks. • One famous event study (1981) looked at CARs of takeover firms around the announcement date.
Challenges to the EMH • Through the years, there have been challenges to the EMH • Post earnings announcement drift • Medium-term momentum • Long-term reversals • January effect • Weekend effect • Size effect • Value/Growth effect
Post earnings announcement drift For positive earnings surprises: • The larger the earnings surprise the higher the positive abnormal return. • The upward drift in the stock price continues a couple of months after the earning announcement!
Post earnings announcement drift For negative earnings surprises: • The larger the negative earnings surprise the larger the loss as measured by the abnormal return. • The downward drift in the stock price continues a couple of months after the earning announcement!
Size Effect Portfolios of small cap stocks earn positive abnormal risk-adjusted returns (+ alphas): Grossman/Stiglitz: Professionals move prices to efficiency. Don’t buy at the small cap end of the market much due to limits on portfolio positions.
January Effect • Returns in January are significantly higher than returns in any other month of the year. • Primarily due to returns in the first two weeks of January • Primarily due to returns for small firms
Why Small cap stocks? Possible sources of risk for small caps • Neglected by analysts and institutional investors, so is less information, which implies higher risk. • Less Liquidity: Higher trading costs as bid-ask spreads are wider, and broker commissions are larger.
Weekend Effect • Over the years, returns on Mondays have been consistently lower than returns on other days of the week. • The bulk of the negative returns come from the diference between Friday’s closing prices and Monday’s opening prices. The interday returns on Monday are not unusual • The Weekend Effect is worse for small stocks • There is no difference between two and three-day weekends • No apparent effect following holidays
Fama-French Findings • Small cap stocks have higher returns. Small cap stocks have higher betas, but it is size not beta driving higher returns. • Low P/E or high Book-to-Market of equity stocks have higher returns.
Fama and French’s Explanation The Market is Semi-Strong Efficient: Small cap stocks and low P/E (high B/M) stocks generate higher returns because they are riskier.
Alternative Explanation The Market Not Semi-Strong Form Efficient: You can make abnormal returns using public information regarding market capitalization and P/E or B/M ratio.
Lo & MacKinlay • Lo and Mackinlay (1988) find positive serial correlation of weekly stock returns for NYSE stocks as the variance of returns increases as the return interval is lengthened. Implies there is inertia in the short run. • The effect is the strongest in the small cap stocks. • Not clear if abnormal returns are possible by exploiting this information.
Short Horizons(Tests of Weak Form EMH) • Other studies of weekly returns found different results • Lehman and Jegadeesh (1990) found evidence of negative serial correlation over short horizons • Gutierrez and Kelley (2006) find both: negaitve serial correlation followed by positive serial correlation
Intermediate Horizons:Test of Weak-Form EMH Study by Jegadeesh and Titman. 1.Measure stock rates of return over the past 6 months. 2.Rank the stocks from highest to lowest past 6 month return and then divide the sample into deciles. “Losers” are the bottom decile and “winners” are the top decile
Jegadeesh and Titman 3. For the next 36 months, every time one of the winners or losers reports quarterly earnings, record 3-day returns starting 2 days before the earnings announcement and ending the day of the announcement. 4.Observe the difference in 3-day returns between the winners and losers reporting earnings in each month.
Evidence: Jegadeesh and Titman • For the 1st 7 months, the market is pleasantly surprised by the earnings announcements of the winners and disappointed by the earnings announcements of the losers. (momentum in the intermediate term)
Evidence: Jegadeesh and Titman • From months 9 - 36, the market is pleasantly surprised by the earnings announcements of the losers and disappointed by the earnings announcements of the winners. (Reversals in the longer term)
Evidence: Jegadeesh and Titman • Abnormal profit opportunities. • Intermediate Run: Inertia • Long Run: Reversals
Mutual Fund Performance • If the stock market is not weak or semi-strong form efficient, then professional portfolio managers should be able to achieve abnormal risk-adjusted returns!
Internet Bubble • Some companies saw their stock price go up just by adding dotcom to their names
Internet Bubble • It is obvious now that the 1998-March 2000 tech run-up was a bubble, but was this market inefficiency, or merely poor valuations? • How do you know a bubble when you are in it? • Should you try to short a bubble if you don’t know when it will burst?
Limits to Arbitrage • Just because you know something is overvalued or undervalued, doesn’t necessarily mean you can make money off it • You must not only be right, but everyone else must realize that you are right – within a reasonable period of time
Limits to Arbitrage • If money managers observe a price discrepancy and commit capital to an arbitrage position based on convergence, the initial movement may be away from convergence, but that merely means there is a greater opportunity for profit, and more capital should be committed. • But that is exactly when investors are most likely to pull out.