Download
1 / 31
310 likes | 481 Vues
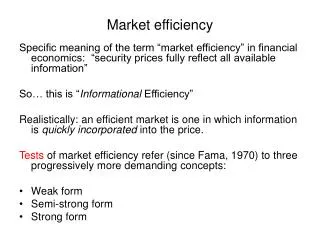
Time Varying Market Efficiency. Efficiency is dynamic We show this by looking at two efficiency metrics Short (intraday) horizon Longer-term (cross-section of monthly stock returns) We then draw implications from results on efficiency dynamics. Estimating short-horizon price efficiency.

E N D
Time Varying Market Efficiency • Efficiency is dynamic • We show this by looking at two efficiency metrics • Short (intraday) horizon • Longer-term (cross-section of monthly stock returns) • We then draw implications from results on efficiency dynamics
Estimating short-horizon price efficiency • We compute daily efficiency measures for individual stocks based on short-horizon return predictability • Chordia, Roll & Subrahmanyam (2005, 2008) • In particular, with RET being return, and OIB order imbalance, for each stock-day, we estimate efficiency as the R2 from the following regression:
Funding Constraints and Market Efficiency • Profitability from growth-value, momentum, accounting profitability is time-varying • Varies with flows to mutual funds and hedge funds that most exploit these anomalies
Trends in Efficiency of the Cross-Section of Monthly Stock Returns
Why is there cross-sectional return predictability? • Risk • Should be stable • Inefficiency • Should be unstable • arbitrageable
We investigate how cross-sectional predictability has changed in recent years • Separately for liquid and illiquid stocks • Separately for NYSE and Nasdaq
Why is the recent period special? • Volume has increased to astonishingly high levels • Spreads have decreased considerably • What has been the effect of dramatically increased trading (about fourfold) and substantially reduced spreads (by about 90%) on cross-sectional return predictability?
Average turnover over time [Chordia, Roll, Subrahmanyam (CRS) 2010]
Bid-ask spreads over time, for small (<$10K) and large orders [CRS, 2010]
We investigate how predictability has changed • Find that it has virtually disappeared for liquid stocks, but not for illiquid stocks • Liquid/Illiquid generally defined as stocks with below/above-median values of Amihud (2002) illiquidity measure • Findings hold across NYSE/AMEX and Nasdaq
Predictive variables • Momentum (RET26, RET712) • Turnover • Book/Market • Illiquidity • Information-based characteristics • Dispersion of analyst forecasts (DISP) • SUE (earnings drift) • Accounting Accruals (ACC)
Trend and turnover fits to Fama-MacBeth coefficients, contd.
Interpretation of trend coefficients • Since RET26, RET712, and SUE positively predict returns, but DISP and ACC negatively predict returns, the trend coefficients indicate that all of these effects have become less material over time
Exponential decay model • Let x be the MA of Fama-MacBeth coefficient, a be its initial value and t be time • x=a exp(-bt) or • Ln(x/a)=-b t • We can estimate the above model via OLS without intercept • A positive b implies decay. We find that all b estimates are positive and most are highly significant
A portfolio approach that uses the entire cross-section • Based on Lehmann (1990) and Lewellen (2002) • One dollar long (short) in stocks whose characteristics are above (below) cross-sectional mean:
Composite strategy • Rank stocks by characteristic and assign percentile ranks • Add percentile ranks to get composite characteristic • Use this rank as characteristic in portfolio weight computation
Potential critiques and defenses • Data mining? But out-of-sample evidence has confirmed the phenomena in other countries and time periods • Statistical power issue? But both subperiods have identical time-periods and many anomalies are statistically significant in the first subperiod
Summary • Results are supportive of the notion that arbitrage due to lower trading costs has improved market efficiency • Market phenomena based on market inefficiency are unstable • Perhaps new anomalies will arise even as old ones disappear
Remarks • The market seems to have become more efficient by conventional metrics • But, unresolved issues: • Is it an issue of academic research discovering anomalies or decreasing trading costs • Are there efficiency cycles (anomalies arbitraged, disappear, arbitrage stops, they appear again)?
How should market efficiency be taught/presented? • It should be presented differently from a static concept. I.e., • Efficiency is indeed time-varying • It also is non-stationary, and likely sensitive to time variation in liquidity